Salvadoran vs South African Receiving Food Stamps
COMPARE
Salvadoran
South African
Receiving Food Stamps
Receiving Food Stamps Comparison
Salvadorans
South Africans
13.2%
RECEIVING FOOD STAMPS
2.7/ 100
METRIC RATING
232nd/ 347
METRIC RANK
10.0%
RECEIVING FOOD STAMPS
98.7/ 100
METRIC RATING
78th/ 347
METRIC RANK
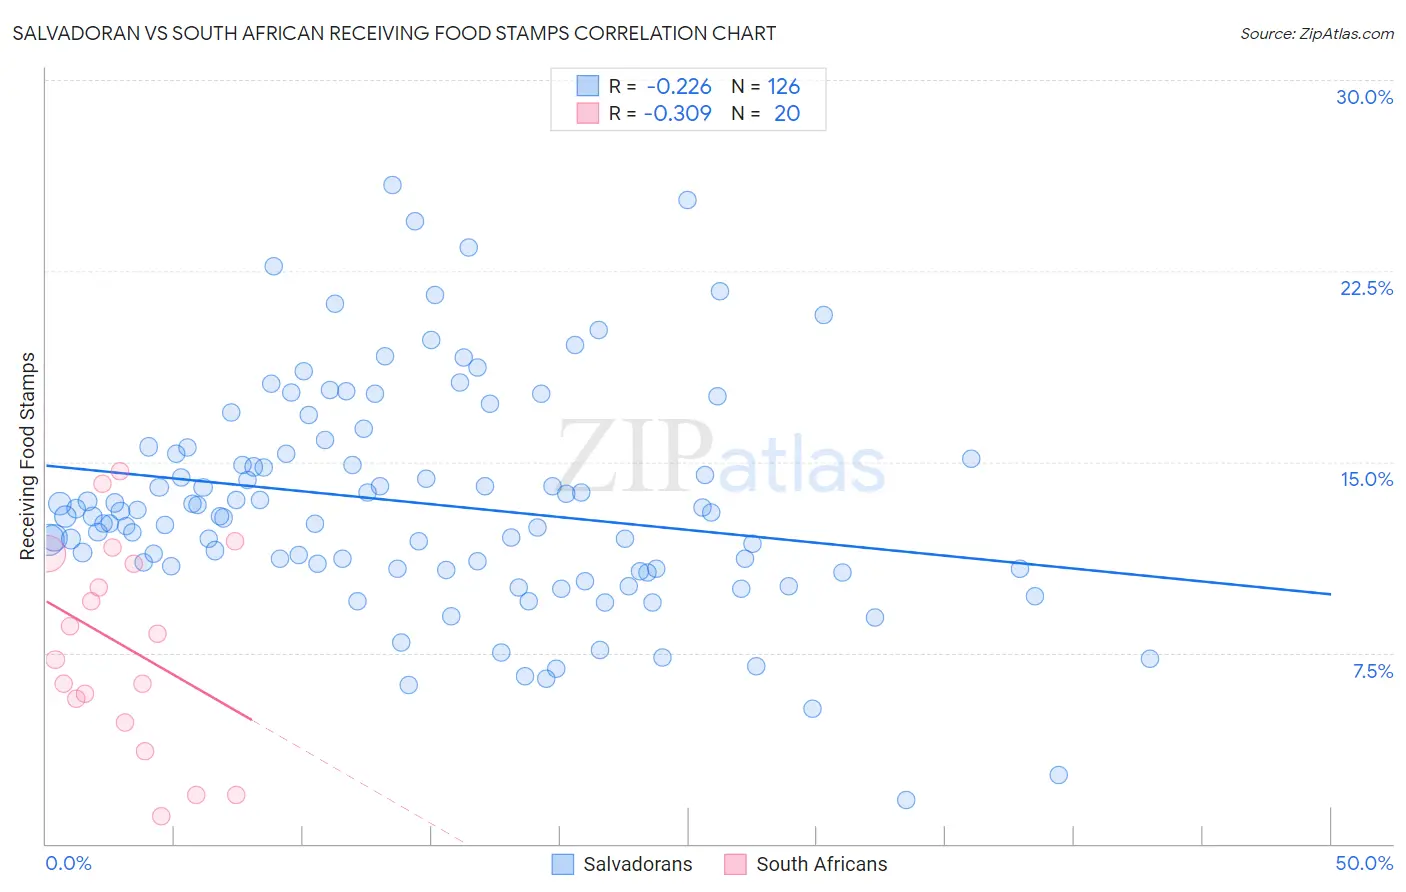
Salvadoran vs South African Receiving Food Stamps Correlation Chart
The statistical analysis conducted on geographies consisting of 398,082,063 people shows a weak negative correlation between the proportion of Salvadorans and percentage of population receiving government assistance and/or food stamps in the United States with a correlation coefficient (R) of -0.226 and weighted average of 13.2%. Similarly, the statistical analysis conducted on geographies consisting of 182,246,088 people shows a mild negative correlation between the proportion of South Africans and percentage of population receiving government assistance and/or food stamps in the United States with a correlation coefficient (R) of -0.309 and weighted average of 10.0%, a difference of 32.6%.
Receiving Food Stamps Correlation Summary
| Measurement | Salvadoran | South African |
| Minimum | 1.7% | 1.1% |
| Maximum | 25.9% | 14.6% |
| Range | 24.2% | 13.5% |
| Mean | 13.4% | 7.8% |
| Median | 12.9% | 7.8% |
| Interquartile 25% (IQ1) | 10.8% | 5.2% |
| Interquartile 75% (IQ3) | 15.3% | 11.2% |
| Interquartile Range (IQR) | 4.5% | 6.0% |
| Standard Deviation (Sample) | 4.4% | 4.0% |
| Standard Deviation (Population) | 4.3% | 3.9% |
Similar Demographics by Receiving Food Stamps
Demographics Similar to Salvadorans by Receiving Food Stamps
In terms of receiving food stamps, the demographic groups most similar to Salvadorans are Cherokee (13.2%, a difference of 0.26%), Comanche (13.3%, a difference of 0.38%), Immigrants from Nigeria (13.1%, a difference of 0.73%), Puget Sound Salish (13.1%, a difference of 0.77%), and Ottawa (13.1%, a difference of 0.82%).
| Demographics | Rating | Rank | Receiving Food Stamps |
| Fijians | 4.3 /100 | #225 | Tragic 13.0% |
| Chickasaw | 3.6 /100 | #226 | Tragic 13.1% |
| Nigerians | 3.5 /100 | #227 | Tragic 13.1% |
| Panamanians | 3.5 /100 | #228 | Tragic 13.1% |
| Ottawa | 3.5 /100 | #229 | Tragic 13.1% |
| Puget Sound Salish | 3.4 /100 | #230 | Tragic 13.1% |
| Immigrants | Nigeria | 3.4 /100 | #231 | Tragic 13.1% |
| Salvadorans | 2.7 /100 | #232 | Tragic 13.2% |
| Cherokee | 2.5 /100 | #233 | Tragic 13.2% |
| Comanche | 2.4 /100 | #234 | Tragic 13.3% |
| Immigrants | Zaire | 1.9 /100 | #235 | Tragic 13.4% |
| Crow | 1.6 /100 | #236 | Tragic 13.4% |
| Immigrants | El Salvador | 1.5 /100 | #237 | Tragic 13.5% |
| French American Indians | 1.4 /100 | #238 | Tragic 13.5% |
| Immigrants | Micronesia | 1.3 /100 | #239 | Tragic 13.5% |
Demographics Similar to South Africans by Receiving Food Stamps
In terms of receiving food stamps, the demographic groups most similar to South Africans are Laotian (10.0%, a difference of 0.040%), Immigrants from North Macedonia (10.0%, a difference of 0.050%), Polish (10.0%, a difference of 0.12%), Immigrants from Croatia (10.0%, a difference of 0.13%), and Immigrants from Zimbabwe (9.9%, a difference of 0.14%).
| Demographics | Rating | Rank | Receiving Food Stamps |
| Scottish | 98.9 /100 | #71 | Exceptional 9.9% |
| Immigrants | Asia | 98.9 /100 | #72 | Exceptional 9.9% |
| Macedonians | 98.9 /100 | #73 | Exceptional 9.9% |
| New Zealanders | 98.8 /100 | #74 | Exceptional 9.9% |
| Immigrants | Zimbabwe | 98.7 /100 | #75 | Exceptional 9.9% |
| Immigrants | Croatia | 98.7 /100 | #76 | Exceptional 10.0% |
| Immigrants | North Macedonia | 98.7 /100 | #77 | Exceptional 10.0% |
| South Africans | 98.7 /100 | #78 | Exceptional 10.0% |
| Laotians | 98.7 /100 | #79 | Exceptional 10.0% |
| Poles | 98.6 /100 | #80 | Exceptional 10.0% |
| Immigrants | England | 98.6 /100 | #81 | Exceptional 10.0% |
| Austrians | 98.6 /100 | #82 | Exceptional 10.0% |
| Dutch | 98.6 /100 | #83 | Exceptional 10.0% |
| Immigrants | Israel | 98.5 /100 | #84 | Exceptional 10.0% |
| Immigrants | Romania | 98.5 /100 | #85 | Exceptional 10.0% |