Salvadoran vs Immigrants from Jordan Receiving Food Stamps
COMPARE
Salvadoran
Immigrants from Jordan
Receiving Food Stamps
Receiving Food Stamps Comparison
Salvadorans
Immigrants from Jordan
13.2%
RECEIVING FOOD STAMPS
2.7/ 100
METRIC RATING
232nd/ 347
METRIC RANK
10.7%
RECEIVING FOOD STAMPS
92.5/ 100
METRIC RATING
128th/ 347
METRIC RANK
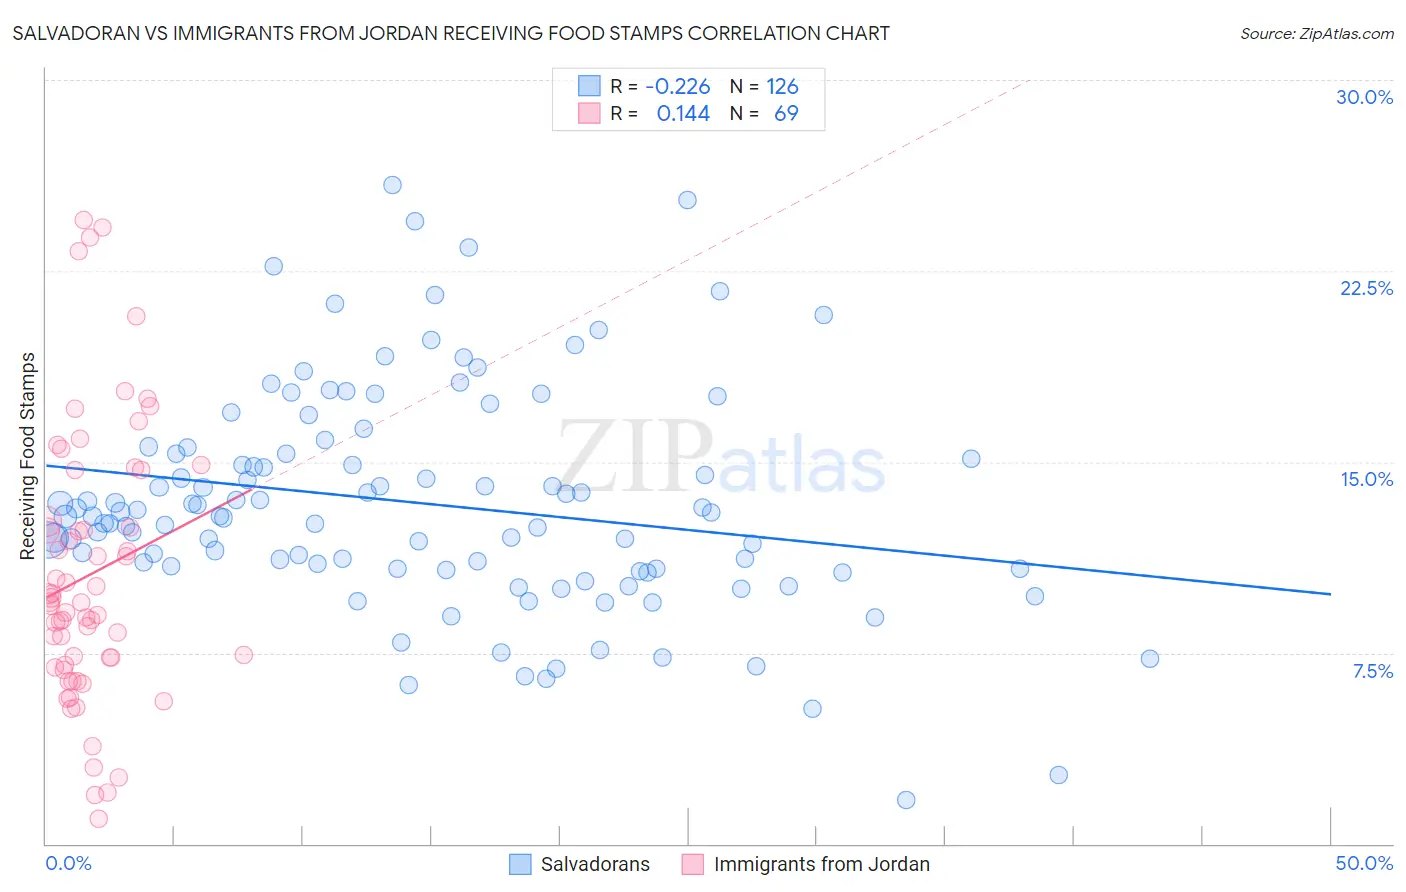
Salvadoran vs Immigrants from Jordan Receiving Food Stamps Correlation Chart
The statistical analysis conducted on geographies consisting of 398,082,063 people shows a weak negative correlation between the proportion of Salvadorans and percentage of population receiving government assistance and/or food stamps in the United States with a correlation coefficient (R) of -0.226 and weighted average of 13.2%. Similarly, the statistical analysis conducted on geographies consisting of 181,094,719 people shows a poor positive correlation between the proportion of Immigrants from Jordan and percentage of population receiving government assistance and/or food stamps in the United States with a correlation coefficient (R) of 0.144 and weighted average of 10.7%, a difference of 23.4%.
Receiving Food Stamps Correlation Summary
| Measurement | Salvadoran | Immigrants from Jordan |
| Minimum | 1.7% | 1.0% |
| Maximum | 25.9% | 24.5% |
| Range | 24.2% | 23.5% |
| Mean | 13.4% | 10.6% |
| Median | 12.9% | 9.5% |
| Interquartile 25% (IQ1) | 10.8% | 7.0% |
| Interquartile 75% (IQ3) | 15.3% | 13.7% |
| Interquartile Range (IQR) | 4.5% | 6.7% |
| Standard Deviation (Sample) | 4.4% | 5.3% |
| Standard Deviation (Population) | 4.3% | 5.3% |
Similar Demographics by Receiving Food Stamps
Demographics Similar to Salvadorans by Receiving Food Stamps
In terms of receiving food stamps, the demographic groups most similar to Salvadorans are Cherokee (13.2%, a difference of 0.26%), Comanche (13.3%, a difference of 0.38%), Immigrants from Nigeria (13.1%, a difference of 0.73%), Puget Sound Salish (13.1%, a difference of 0.77%), and Ottawa (13.1%, a difference of 0.82%).
| Demographics | Rating | Rank | Receiving Food Stamps |
| Fijians | 4.3 /100 | #225 | Tragic 13.0% |
| Chickasaw | 3.6 /100 | #226 | Tragic 13.1% |
| Nigerians | 3.5 /100 | #227 | Tragic 13.1% |
| Panamanians | 3.5 /100 | #228 | Tragic 13.1% |
| Ottawa | 3.5 /100 | #229 | Tragic 13.1% |
| Puget Sound Salish | 3.4 /100 | #230 | Tragic 13.1% |
| Immigrants | Nigeria | 3.4 /100 | #231 | Tragic 13.1% |
| Salvadorans | 2.7 /100 | #232 | Tragic 13.2% |
| Cherokee | 2.5 /100 | #233 | Tragic 13.2% |
| Comanche | 2.4 /100 | #234 | Tragic 13.3% |
| Immigrants | Zaire | 1.9 /100 | #235 | Tragic 13.4% |
| Crow | 1.6 /100 | #236 | Tragic 13.4% |
| Immigrants | El Salvador | 1.5 /100 | #237 | Tragic 13.5% |
| French American Indians | 1.4 /100 | #238 | Tragic 13.5% |
| Immigrants | Micronesia | 1.3 /100 | #239 | Tragic 13.5% |
Demographics Similar to Immigrants from Jordan by Receiving Food Stamps
In terms of receiving food stamps, the demographic groups most similar to Immigrants from Jordan are Yugoslavian (10.7%, a difference of 0.0%), Immigrants from Ethiopia (10.7%, a difference of 0.010%), Afghan (10.7%, a difference of 0.030%), Israeli (10.7%, a difference of 0.10%), and French (10.7%, a difference of 0.10%).
| Demographics | Rating | Rank | Receiving Food Stamps |
| Slavs | 93.8 /100 | #121 | Exceptional 10.6% |
| Sri Lankans | 93.7 /100 | #122 | Exceptional 10.6% |
| Immigrants | Philippines | 93.3 /100 | #123 | Exceptional 10.7% |
| Paraguayans | 93.0 /100 | #124 | Exceptional 10.7% |
| Ukrainians | 92.8 /100 | #125 | Exceptional 10.7% |
| Afghans | 92.6 /100 | #126 | Exceptional 10.7% |
| Immigrants | Ethiopia | 92.6 /100 | #127 | Exceptional 10.7% |
| Immigrants | Jordan | 92.5 /100 | #128 | Exceptional 10.7% |
| Yugoslavians | 92.5 /100 | #129 | Exceptional 10.7% |
| Israelis | 92.4 /100 | #130 | Exceptional 10.7% |
| French | 92.3 /100 | #131 | Exceptional 10.7% |
| Immigrants | Germany | 92.0 /100 | #132 | Exceptional 10.7% |
| Immigrants | Russia | 90.9 /100 | #133 | Exceptional 10.8% |
| Immigrants | Brazil | 90.3 /100 | #134 | Exceptional 10.8% |
| Argentineans | 90.2 /100 | #135 | Exceptional 10.8% |