Salvadoran vs Immigrants from Czechoslovakia Receiving Food Stamps
COMPARE
Salvadoran
Immigrants from Czechoslovakia
Receiving Food Stamps
Receiving Food Stamps Comparison
Salvadorans
Immigrants from Czechoslovakia
13.2%
RECEIVING FOOD STAMPS
2.7/ 100
METRIC RATING
232nd/ 347
METRIC RANK
9.6%
RECEIVING FOOD STAMPS
99.4/ 100
METRIC RATING
49th/ 347
METRIC RANK
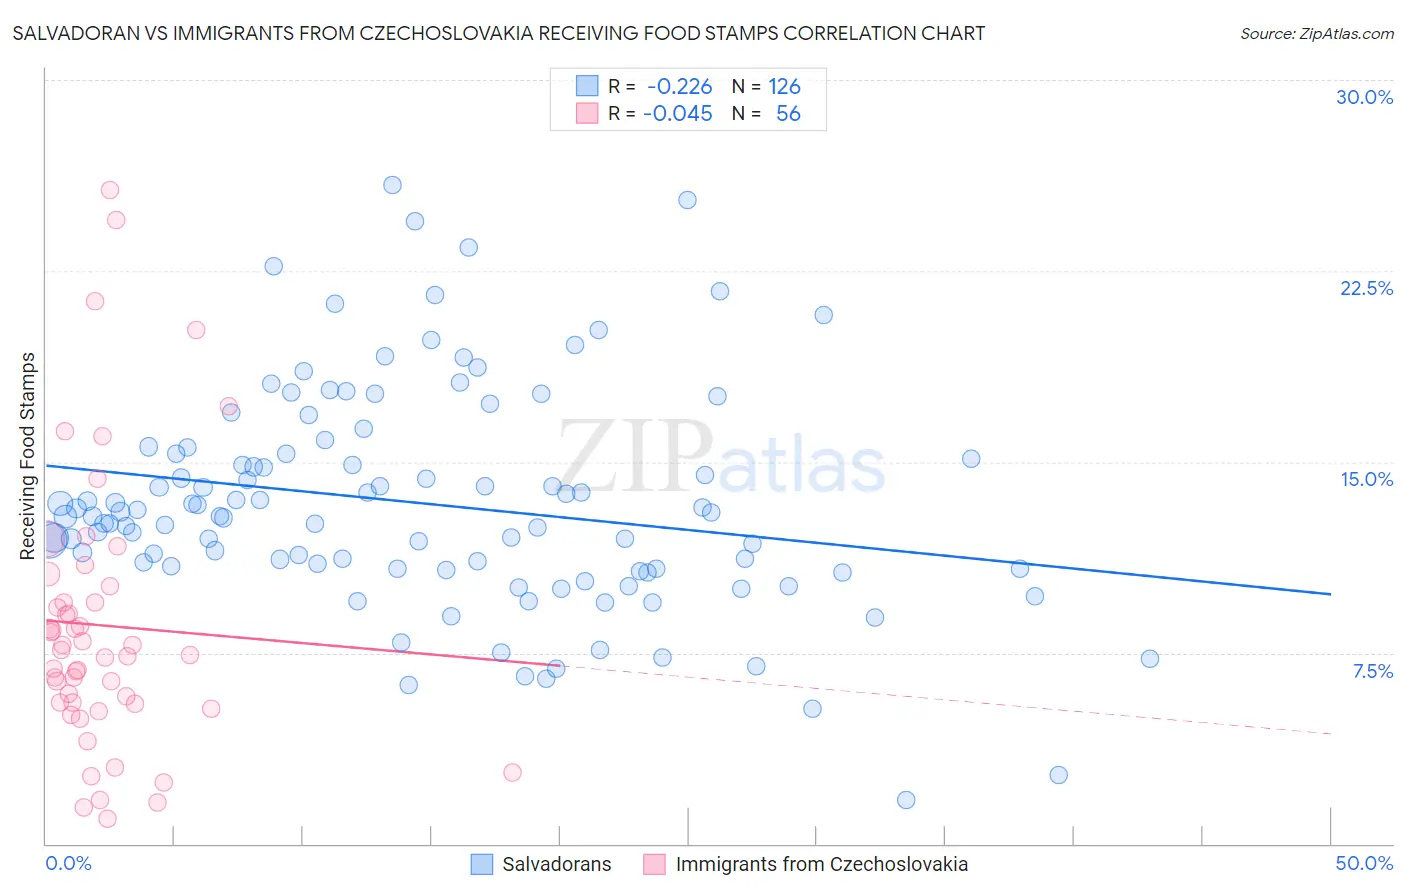
Salvadoran vs Immigrants from Czechoslovakia Receiving Food Stamps Correlation Chart
The statistical analysis conducted on geographies consisting of 398,082,063 people shows a weak negative correlation between the proportion of Salvadorans and percentage of population receiving government assistance and/or food stamps in the United States with a correlation coefficient (R) of -0.226 and weighted average of 13.2%. Similarly, the statistical analysis conducted on geographies consisting of 195,237,921 people shows no correlation between the proportion of Immigrants from Czechoslovakia and percentage of population receiving government assistance and/or food stamps in the United States with a correlation coefficient (R) of -0.045 and weighted average of 9.6%, a difference of 37.0%.
Receiving Food Stamps Correlation Summary
| Measurement | Salvadoran | Immigrants from Czechoslovakia |
| Minimum | 1.7% | 1.0% |
| Maximum | 25.9% | 25.7% |
| Range | 24.2% | 24.7% |
| Mean | 13.4% | 8.6% |
| Median | 12.9% | 7.5% |
| Interquartile 25% (IQ1) | 10.8% | 5.5% |
| Interquartile 75% (IQ3) | 15.3% | 9.8% |
| Interquartile Range (IQR) | 4.5% | 4.3% |
| Standard Deviation (Sample) | 4.4% | 5.4% |
| Standard Deviation (Population) | 4.3% | 5.3% |
Similar Demographics by Receiving Food Stamps
Demographics Similar to Salvadorans by Receiving Food Stamps
In terms of receiving food stamps, the demographic groups most similar to Salvadorans are Cherokee (13.2%, a difference of 0.26%), Comanche (13.3%, a difference of 0.38%), Immigrants from Nigeria (13.1%, a difference of 0.73%), Puget Sound Salish (13.1%, a difference of 0.77%), and Ottawa (13.1%, a difference of 0.82%).
| Demographics | Rating | Rank | Receiving Food Stamps |
| Fijians | 4.3 /100 | #225 | Tragic 13.0% |
| Chickasaw | 3.6 /100 | #226 | Tragic 13.1% |
| Nigerians | 3.5 /100 | #227 | Tragic 13.1% |
| Panamanians | 3.5 /100 | #228 | Tragic 13.1% |
| Ottawa | 3.5 /100 | #229 | Tragic 13.1% |
| Puget Sound Salish | 3.4 /100 | #230 | Tragic 13.1% |
| Immigrants | Nigeria | 3.4 /100 | #231 | Tragic 13.1% |
| Salvadorans | 2.7 /100 | #232 | Tragic 13.2% |
| Cherokee | 2.5 /100 | #233 | Tragic 13.2% |
| Comanche | 2.4 /100 | #234 | Tragic 13.3% |
| Immigrants | Zaire | 1.9 /100 | #235 | Tragic 13.4% |
| Crow | 1.6 /100 | #236 | Tragic 13.4% |
| Immigrants | El Salvador | 1.5 /100 | #237 | Tragic 13.5% |
| French American Indians | 1.4 /100 | #238 | Tragic 13.5% |
| Immigrants | Micronesia | 1.3 /100 | #239 | Tragic 13.5% |
Demographics Similar to Immigrants from Czechoslovakia by Receiving Food Stamps
In terms of receiving food stamps, the demographic groups most similar to Immigrants from Czechoslovakia are Russian (9.6%, a difference of 0.020%), Indian (Asian) (9.6%, a difference of 0.13%), Australian (9.6%, a difference of 0.19%), Lithuanian (9.7%, a difference of 0.25%), and Immigrants from Belgium (9.6%, a difference of 0.27%).
| Demographics | Rating | Rank | Receiving Food Stamps |
| Immigrants | China | 99.5 /100 | #42 | Exceptional 9.6% |
| Croatians | 99.5 /100 | #43 | Exceptional 9.6% |
| Immigrants | Denmark | 99.4 /100 | #44 | Exceptional 9.6% |
| Immigrants | Belgium | 99.4 /100 | #45 | Exceptional 9.6% |
| Australians | 99.4 /100 | #46 | Exceptional 9.6% |
| Indians (Asian) | 99.4 /100 | #47 | Exceptional 9.6% |
| Russians | 99.4 /100 | #48 | Exceptional 9.6% |
| Immigrants | Czechoslovakia | 99.4 /100 | #49 | Exceptional 9.6% |
| Lithuanians | 99.4 /100 | #50 | Exceptional 9.7% |
| Asians | 99.3 /100 | #51 | Exceptional 9.7% |
| Immigrants | South Africa | 99.3 /100 | #52 | Exceptional 9.7% |
| Tongans | 99.3 /100 | #53 | Exceptional 9.7% |
| Swiss | 99.3 /100 | #54 | Exceptional 9.7% |
| Immigrants | Switzerland | 99.3 /100 | #55 | Exceptional 9.7% |
| Immigrants | Canada | 99.3 /100 | #56 | Exceptional 9.7% |