Salvadoran vs Immigrants from Laos Receiving Food Stamps
COMPARE
Salvadoran
Immigrants from Laos
Receiving Food Stamps
Receiving Food Stamps Comparison
Salvadorans
Immigrants from Laos
13.2%
RECEIVING FOOD STAMPS
2.7/ 100
METRIC RATING
232nd/ 347
METRIC RANK
13.8%
RECEIVING FOOD STAMPS
0.7/ 100
METRIC RATING
248th/ 347
METRIC RANK
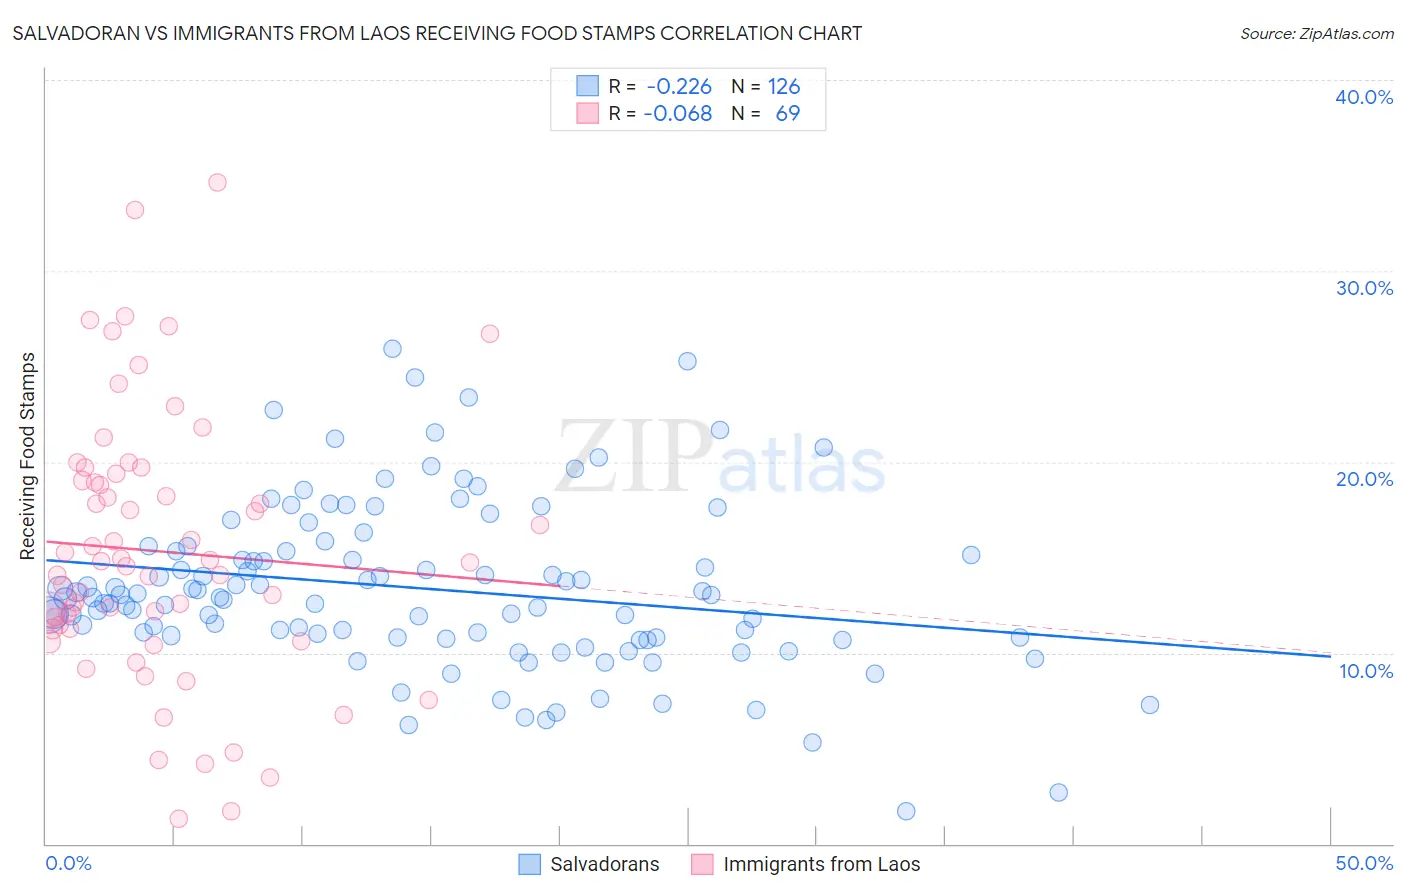
Salvadoran vs Immigrants from Laos Receiving Food Stamps Correlation Chart
The statistical analysis conducted on geographies consisting of 398,082,063 people shows a weak negative correlation between the proportion of Salvadorans and percentage of population receiving government assistance and/or food stamps in the United States with a correlation coefficient (R) of -0.226 and weighted average of 13.2%. Similarly, the statistical analysis conducted on geographies consisting of 201,380,139 people shows a slight negative correlation between the proportion of Immigrants from Laos and percentage of population receiving government assistance and/or food stamps in the United States with a correlation coefficient (R) of -0.068 and weighted average of 13.8%, a difference of 4.2%.
Receiving Food Stamps Correlation Summary
| Measurement | Salvadoran | Immigrants from Laos |
| Minimum | 1.7% | 1.3% |
| Maximum | 25.9% | 34.6% |
| Range | 24.2% | 33.3% |
| Mean | 13.4% | 15.3% |
| Median | 12.9% | 14.7% |
| Interquartile 25% (IQ1) | 10.8% | 11.3% |
| Interquartile 75% (IQ3) | 15.3% | 19.2% |
| Interquartile Range (IQR) | 4.5% | 8.0% |
| Standard Deviation (Sample) | 4.4% | 7.0% |
| Standard Deviation (Population) | 4.3% | 6.9% |
Demographics Similar to Salvadorans and Immigrants from Laos by Receiving Food Stamps
In terms of receiving food stamps, the demographic groups most similar to Salvadorans are Cherokee (13.2%, a difference of 0.26%), Comanche (13.3%, a difference of 0.38%), Immigrants from Nigeria (13.1%, a difference of 0.73%), Puget Sound Salish (13.1%, a difference of 0.77%), and Immigrants from Zaire (13.4%, a difference of 1.1%). Similarly, the demographic groups most similar to Immigrants from Laos are Mexican American Indian (13.8%, a difference of 0.10%), Cree (13.7%, a difference of 0.36%), Immigrants from Somalia (13.7%, a difference of 0.60%), Indonesian (13.9%, a difference of 0.63%), and Cajun (13.7%, a difference of 0.65%).
| Demographics | Rating | Rank | Receiving Food Stamps |
| Puget Sound Salish | 3.4 /100 | #230 | Tragic 13.1% |
| Immigrants | Nigeria | 3.4 /100 | #231 | Tragic 13.1% |
| Salvadorans | 2.7 /100 | #232 | Tragic 13.2% |
| Cherokee | 2.5 /100 | #233 | Tragic 13.2% |
| Comanche | 2.4 /100 | #234 | Tragic 13.3% |
| Immigrants | Zaire | 1.9 /100 | #235 | Tragic 13.4% |
| Crow | 1.6 /100 | #236 | Tragic 13.4% |
| Immigrants | El Salvador | 1.5 /100 | #237 | Tragic 13.5% |
| French American Indians | 1.4 /100 | #238 | Tragic 13.5% |
| Immigrants | Micronesia | 1.3 /100 | #239 | Tragic 13.5% |
| Iroquois | 1.2 /100 | #240 | Tragic 13.5% |
| Choctaw | 1.0 /100 | #241 | Tragic 13.6% |
| Immigrants | Panama | 1.0 /100 | #242 | Tragic 13.6% |
| Somalis | 0.9 /100 | #243 | Tragic 13.7% |
| Cajuns | 0.9 /100 | #244 | Tragic 13.7% |
| Immigrants | Somalia | 0.9 /100 | #245 | Tragic 13.7% |
| Cree | 0.8 /100 | #246 | Tragic 13.7% |
| Mexican American Indians | 0.7 /100 | #247 | Tragic 13.8% |
| Immigrants | Laos | 0.7 /100 | #248 | Tragic 13.8% |
| Indonesians | 0.6 /100 | #249 | Tragic 13.9% |
| Immigrants | Cambodia | 0.5 /100 | #250 | Tragic 13.9% |