Celtic vs South African Receiving Food Stamps
COMPARE
Celtic
South African
Receiving Food Stamps
Receiving Food Stamps Comparison
Celtics
South Africans
10.9%
RECEIVING FOOD STAMPS
87.8/ 100
METRIC RATING
140th/ 347
METRIC RANK
10.0%
RECEIVING FOOD STAMPS
98.7/ 100
METRIC RATING
78th/ 347
METRIC RANK
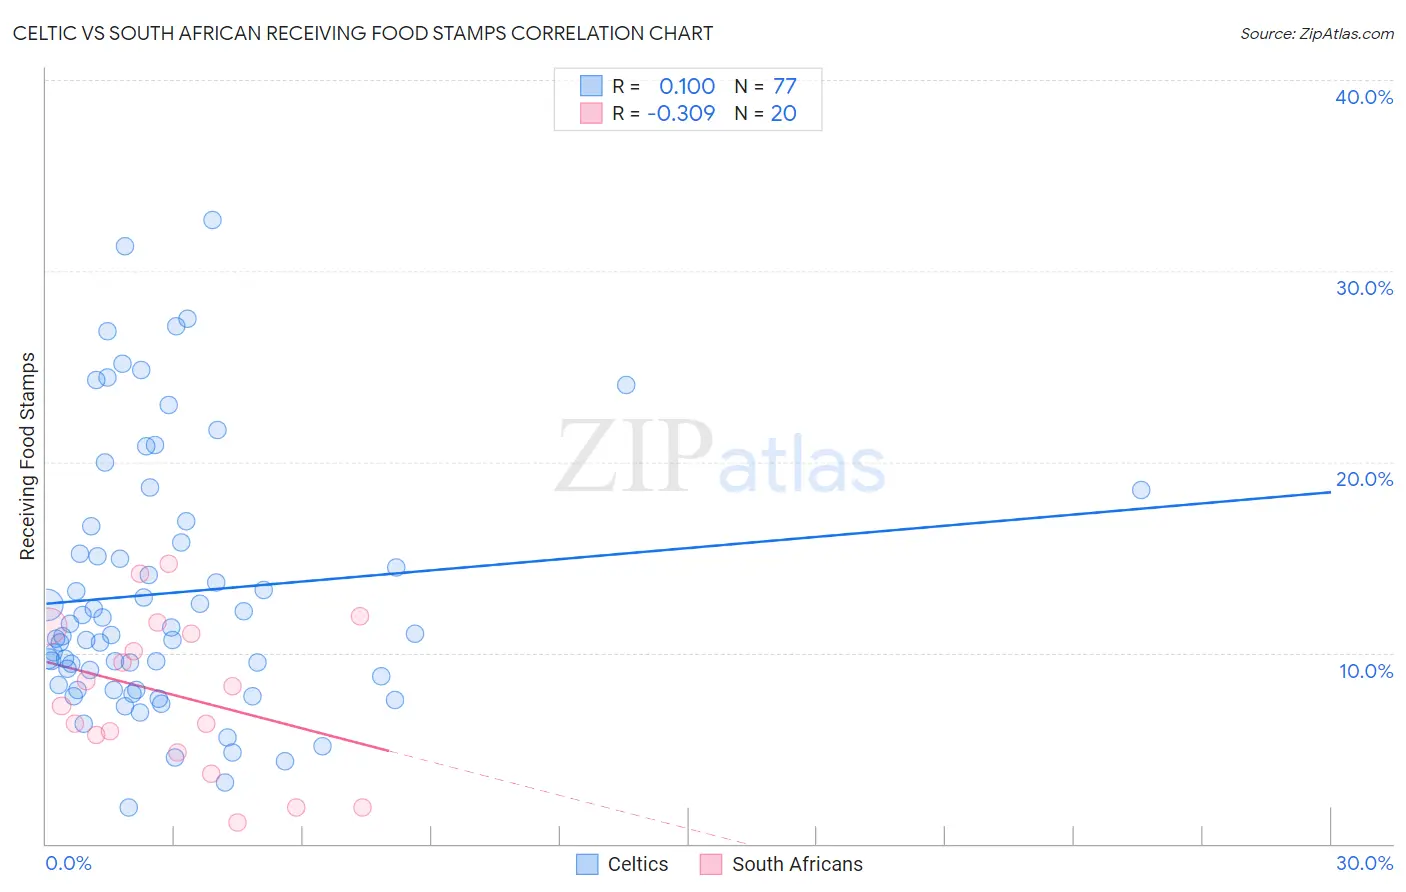
Celtic vs South African Receiving Food Stamps Correlation Chart
The statistical analysis conducted on geographies consisting of 168,687,125 people shows a slight positive correlation between the proportion of Celtics and percentage of population receiving government assistance and/or food stamps in the United States with a correlation coefficient (R) of 0.100 and weighted average of 10.9%. Similarly, the statistical analysis conducted on geographies consisting of 182,246,088 people shows a mild negative correlation between the proportion of South Africans and percentage of population receiving government assistance and/or food stamps in the United States with a correlation coefficient (R) of -0.309 and weighted average of 10.0%, a difference of 9.7%.
Receiving Food Stamps Correlation Summary
| Measurement | Celtic | South African |
| Minimum | 1.9% | 1.1% |
| Maximum | 32.7% | 14.6% |
| Range | 30.8% | 13.5% |
| Mean | 13.1% | 7.8% |
| Median | 11.0% | 7.8% |
| Interquartile 25% (IQ1) | 8.2% | 5.2% |
| Interquartile 75% (IQ3) | 16.2% | 11.2% |
| Interquartile Range (IQR) | 8.0% | 6.0% |
| Standard Deviation (Sample) | 6.9% | 4.0% |
| Standard Deviation (Population) | 6.8% | 3.9% |
Similar Demographics by Receiving Food Stamps
Demographics Similar to Celtics by Receiving Food Stamps
In terms of receiving food stamps, the demographic groups most similar to Celtics are Hmong (10.9%, a difference of 0.20%), Immigrants from Moldova (10.9%, a difference of 0.24%), Immigrants from Vietnam (11.0%, a difference of 0.36%), Chilean (11.0%, a difference of 0.53%), and Immigrants from Northern Africa (11.0%, a difference of 0.61%).
| Demographics | Rating | Rank | Receiving Food Stamps |
| Immigrants | Russia | 90.9 /100 | #133 | Exceptional 10.8% |
| Immigrants | Brazil | 90.3 /100 | #134 | Exceptional 10.8% |
| Argentineans | 90.2 /100 | #135 | Exceptional 10.8% |
| Slovaks | 89.8 /100 | #136 | Excellent 10.8% |
| Immigrants | Eastern Europe | 89.8 /100 | #137 | Excellent 10.8% |
| Immigrants | Moldova | 88.5 /100 | #138 | Excellent 10.9% |
| Hmong | 88.4 /100 | #139 | Excellent 10.9% |
| Celtics | 87.8 /100 | #140 | Excellent 10.9% |
| Immigrants | Vietnam | 86.7 /100 | #141 | Excellent 11.0% |
| Chileans | 86.2 /100 | #142 | Excellent 11.0% |
| Immigrants | Northern Africa | 86.0 /100 | #143 | Excellent 11.0% |
| Syrians | 85.5 /100 | #144 | Excellent 11.0% |
| Hungarians | 85.1 /100 | #145 | Excellent 11.0% |
| Taiwanese | 84.2 /100 | #146 | Excellent 11.0% |
| Whites/Caucasians | 83.9 /100 | #147 | Excellent 11.1% |
Demographics Similar to South Africans by Receiving Food Stamps
In terms of receiving food stamps, the demographic groups most similar to South Africans are Laotian (10.0%, a difference of 0.040%), Immigrants from North Macedonia (10.0%, a difference of 0.050%), Polish (10.0%, a difference of 0.12%), Immigrants from Croatia (10.0%, a difference of 0.13%), and Immigrants from Zimbabwe (9.9%, a difference of 0.14%).
| Demographics | Rating | Rank | Receiving Food Stamps |
| Scottish | 98.9 /100 | #71 | Exceptional 9.9% |
| Immigrants | Asia | 98.9 /100 | #72 | Exceptional 9.9% |
| Macedonians | 98.9 /100 | #73 | Exceptional 9.9% |
| New Zealanders | 98.8 /100 | #74 | Exceptional 9.9% |
| Immigrants | Zimbabwe | 98.7 /100 | #75 | Exceptional 9.9% |
| Immigrants | Croatia | 98.7 /100 | #76 | Exceptional 10.0% |
| Immigrants | North Macedonia | 98.7 /100 | #77 | Exceptional 10.0% |
| South Africans | 98.7 /100 | #78 | Exceptional 10.0% |
| Laotians | 98.7 /100 | #79 | Exceptional 10.0% |
| Poles | 98.6 /100 | #80 | Exceptional 10.0% |
| Immigrants | England | 98.6 /100 | #81 | Exceptional 10.0% |
| Austrians | 98.6 /100 | #82 | Exceptional 10.0% |
| Dutch | 98.6 /100 | #83 | Exceptional 10.0% |
| Immigrants | Israel | 98.5 /100 | #84 | Exceptional 10.0% |
| Immigrants | Romania | 98.5 /100 | #85 | Exceptional 10.0% |