Spanish American Indian vs South African Receiving Food Stamps
COMPARE
Spanish American Indian
South African
Receiving Food Stamps
Receiving Food Stamps Comparison
Spanish American Indians
South Africans
14.9%
RECEIVING FOOD STAMPS
0.0/ 100
METRIC RATING
281st/ 347
METRIC RANK
10.0%
RECEIVING FOOD STAMPS
98.7/ 100
METRIC RATING
78th/ 347
METRIC RANK
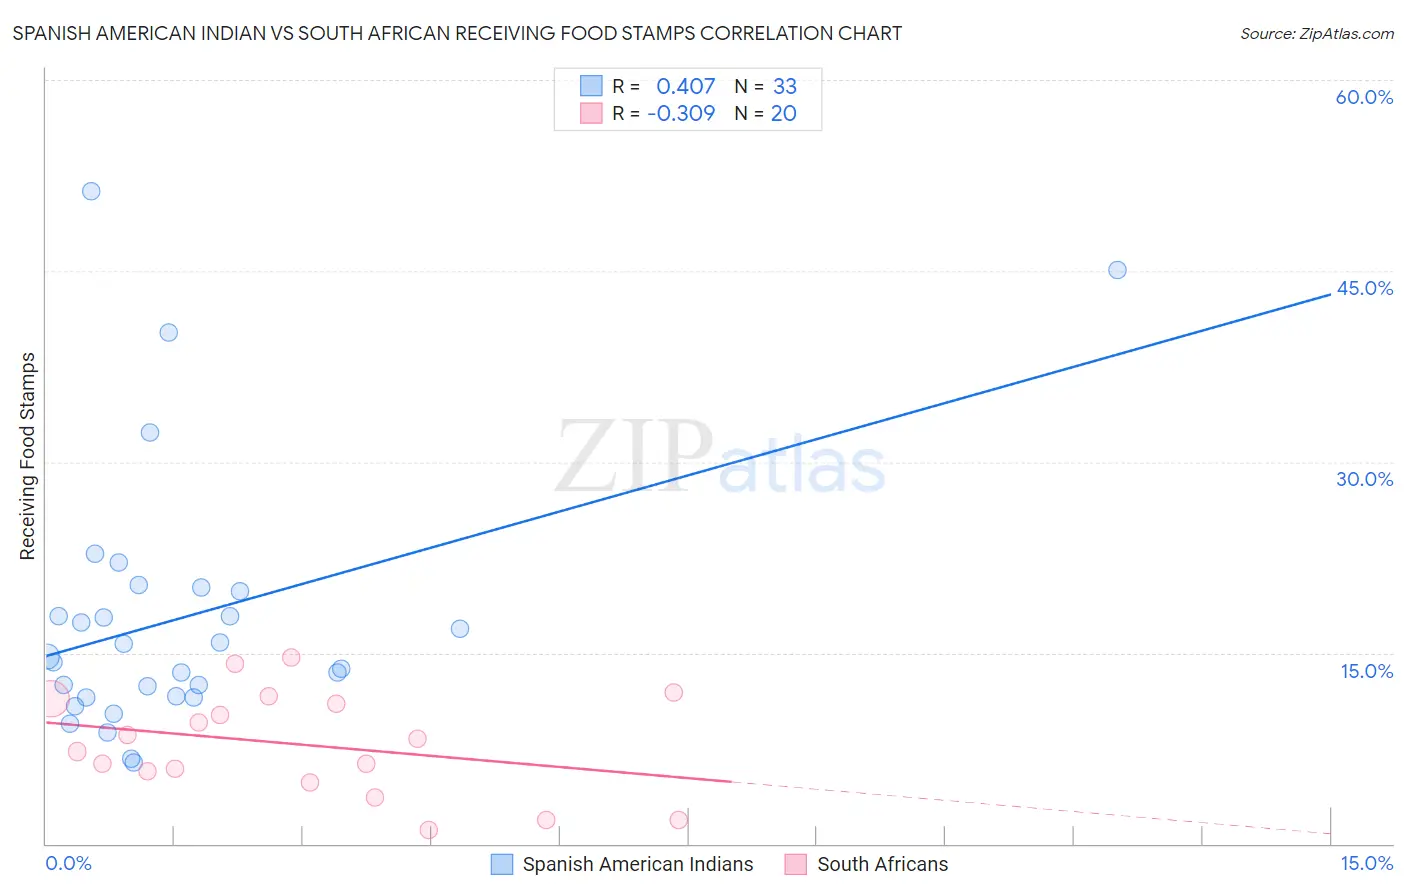
Spanish American Indian vs South African Receiving Food Stamps Correlation Chart
The statistical analysis conducted on geographies consisting of 73,107,965 people shows a moderate positive correlation between the proportion of Spanish American Indians and percentage of population receiving government assistance and/or food stamps in the United States with a correlation coefficient (R) of 0.407 and weighted average of 14.9%. Similarly, the statistical analysis conducted on geographies consisting of 182,246,088 people shows a mild negative correlation between the proportion of South Africans and percentage of population receiving government assistance and/or food stamps in the United States with a correlation coefficient (R) of -0.309 and weighted average of 10.0%, a difference of 49.8%.
Receiving Food Stamps Correlation Summary
| Measurement | Spanish American Indian | South African |
| Minimum | 6.4% | 1.1% |
| Maximum | 51.3% | 14.6% |
| Range | 44.9% | 13.5% |
| Mean | 17.8% | 7.8% |
| Median | 14.7% | 7.8% |
| Interquartile 25% (IQ1) | 11.5% | 5.2% |
| Interquartile 75% (IQ3) | 20.0% | 11.2% |
| Interquartile Range (IQR) | 8.5% | 6.0% |
| Standard Deviation (Sample) | 10.4% | 4.0% |
| Standard Deviation (Population) | 10.2% | 3.9% |
Similar Demographics by Receiving Food Stamps
Demographics Similar to Spanish American Indians by Receiving Food Stamps
In terms of receiving food stamps, the demographic groups most similar to Spanish American Indians are Ecuadorian (14.9%, a difference of 0.32%), Kiowa (14.9%, a difference of 0.37%), Immigrants from Central America (15.0%, a difference of 0.52%), Belizean (14.8%, a difference of 0.64%), and Seminole (14.8%, a difference of 0.77%).
| Demographics | Rating | Rank | Receiving Food Stamps |
| Immigrants | Western Africa | 0.1 /100 | #274 | Tragic 14.7% |
| Ute | 0.1 /100 | #275 | Tragic 14.7% |
| Liberians | 0.1 /100 | #276 | Tragic 14.8% |
| Seminole | 0.1 /100 | #277 | Tragic 14.8% |
| Belizeans | 0.1 /100 | #278 | Tragic 14.8% |
| Kiowa | 0.0 /100 | #279 | Tragic 14.9% |
| Ecuadorians | 0.0 /100 | #280 | Tragic 14.9% |
| Spanish American Indians | 0.0 /100 | #281 | Tragic 14.9% |
| Immigrants | Central America | 0.0 /100 | #282 | Tragic 15.0% |
| Bangladeshis | 0.0 /100 | #283 | Tragic 15.0% |
| Immigrants | Ecuador | 0.0 /100 | #284 | Tragic 15.0% |
| Immigrants | Liberia | 0.0 /100 | #285 | Tragic 15.1% |
| Africans | 0.0 /100 | #286 | Tragic 15.1% |
| Immigrants | Mexico | 0.0 /100 | #287 | Tragic 15.2% |
| Immigrants | Belize | 0.0 /100 | #288 | Tragic 15.2% |
Demographics Similar to South Africans by Receiving Food Stamps
In terms of receiving food stamps, the demographic groups most similar to South Africans are Laotian (10.0%, a difference of 0.040%), Immigrants from North Macedonia (10.0%, a difference of 0.050%), Polish (10.0%, a difference of 0.12%), Immigrants from Croatia (10.0%, a difference of 0.13%), and Immigrants from Zimbabwe (9.9%, a difference of 0.14%).
| Demographics | Rating | Rank | Receiving Food Stamps |
| Scottish | 98.9 /100 | #71 | Exceptional 9.9% |
| Immigrants | Asia | 98.9 /100 | #72 | Exceptional 9.9% |
| Macedonians | 98.9 /100 | #73 | Exceptional 9.9% |
| New Zealanders | 98.8 /100 | #74 | Exceptional 9.9% |
| Immigrants | Zimbabwe | 98.7 /100 | #75 | Exceptional 9.9% |
| Immigrants | Croatia | 98.7 /100 | #76 | Exceptional 10.0% |
| Immigrants | North Macedonia | 98.7 /100 | #77 | Exceptional 10.0% |
| South Africans | 98.7 /100 | #78 | Exceptional 10.0% |
| Laotians | 98.7 /100 | #79 | Exceptional 10.0% |
| Poles | 98.6 /100 | #80 | Exceptional 10.0% |
| Immigrants | England | 98.6 /100 | #81 | Exceptional 10.0% |
| Austrians | 98.6 /100 | #82 | Exceptional 10.0% |
| Dutch | 98.6 /100 | #83 | Exceptional 10.0% |
| Immigrants | Israel | 98.5 /100 | #84 | Exceptional 10.0% |
| Immigrants | Romania | 98.5 /100 | #85 | Exceptional 10.0% |