Russian vs Immigrants from Hong Kong Median Family Income
COMPARE
Russian
Immigrants from Hong Kong
Median Family Income
Median Family Income Comparison
Russians
Immigrants from Hong Kong
$120,487
MEDIAN FAMILY INCOME
100.0/ 100
METRIC RATING
27th/ 347
METRIC RANK
$131,067
MEDIAN FAMILY INCOME
100.0/ 100
METRIC RATING
7th/ 347
METRIC RANK
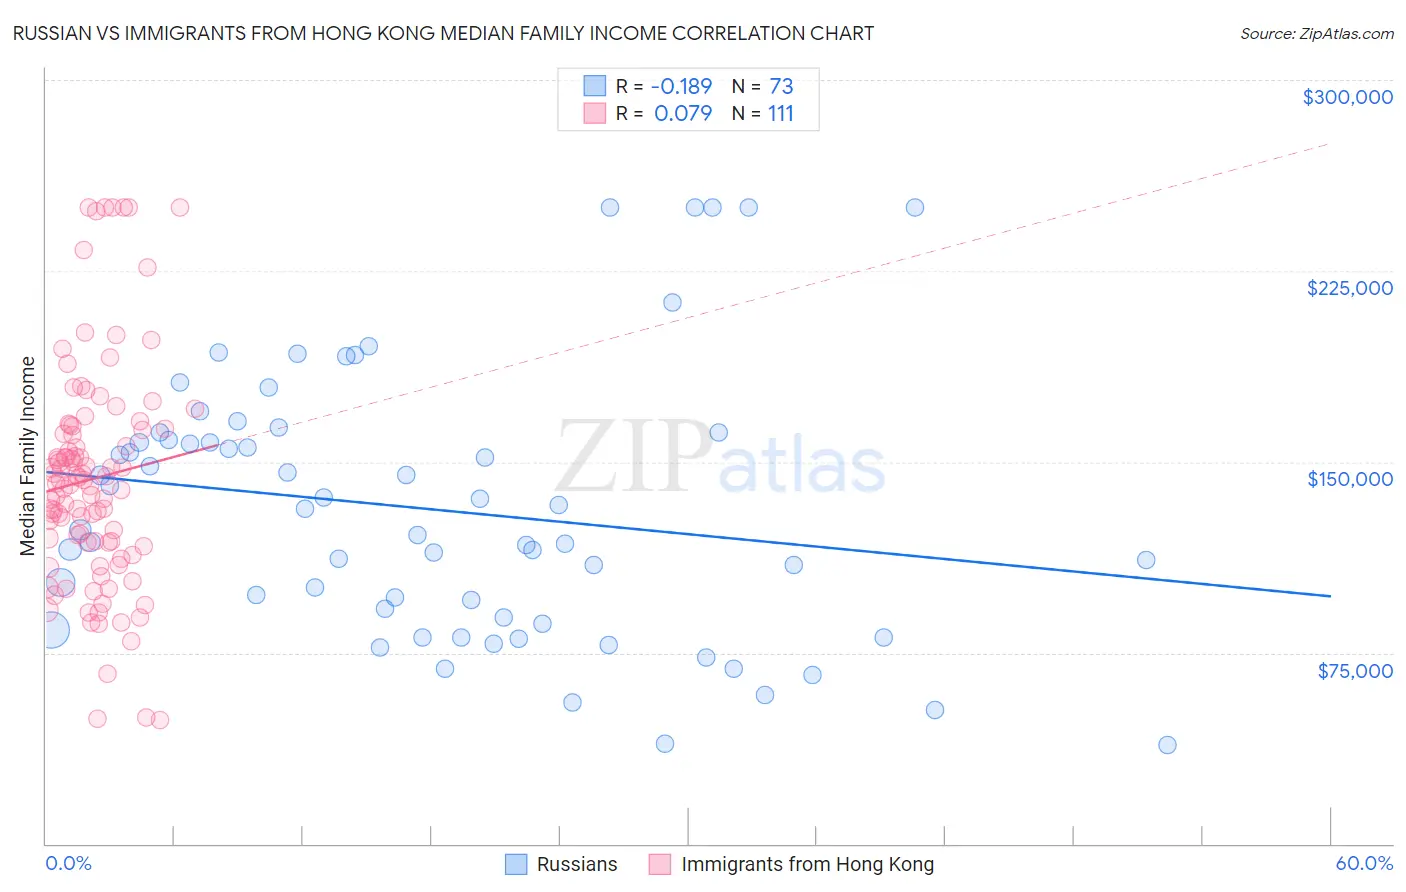
Russian vs Immigrants from Hong Kong Median Family Income Correlation Chart
The statistical analysis conducted on geographies consisting of 511,404,289 people shows a poor negative correlation between the proportion of Russians and median family income in the United States with a correlation coefficient (R) of -0.189 and weighted average of $120,487. Similarly, the statistical analysis conducted on geographies consisting of 253,853,035 people shows a slight positive correlation between the proportion of Immigrants from Hong Kong and median family income in the United States with a correlation coefficient (R) of 0.079 and weighted average of $131,067, a difference of 8.8%.
Median Family Income Correlation Summary
| Measurement | Russian | Immigrants from Hong Kong |
| Minimum | $38,939 | $48,750 |
| Maximum | $250,001 | $250,001 |
| Range | $211,062 | $201,251 |
| Mean | $131,214 | $143,316 |
| Median | $123,457 | $141,440 |
| Interquartile 25% (IQ1) | $87,492 | $118,209 |
| Interquartile 75% (IQ3) | $160,004 | $163,135 |
| Interquartile Range (IQR) | $72,512 | $44,926 |
| Standard Deviation (Sample) | $52,364 | $43,770 |
| Standard Deviation (Population) | $52,005 | $43,572 |
Demographics Similar to Russians and Immigrants from Hong Kong by Median Family Income
In terms of median family income, the demographic groups most similar to Russians are Immigrants from Switzerland ($120,726, a difference of 0.20%), Turkish ($121,202, a difference of 0.59%), Immigrants from Northern Europe ($121,840, a difference of 1.1%), Immigrants from Sweden ($122,765, a difference of 1.9%), and Immigrants from Japan ($122,764, a difference of 1.9%). Similarly, the demographic groups most similar to Immigrants from Hong Kong are Immigrants from Iran ($130,894, a difference of 0.13%), Okinawan ($129,979, a difference of 0.84%), Immigrants from Ireland ($127,584, a difference of 2.7%), Immigrants from Israel ($127,430, a difference of 2.9%), and Cypriot ($127,064, a difference of 3.2%).
| Demographics | Rating | Rank | Median Family Income |
| Immigrants | Hong Kong | 100.0 /100 | #7 | Exceptional $131,067 |
| Immigrants | Iran | 100.0 /100 | #8 | Exceptional $130,894 |
| Okinawans | 100.0 /100 | #9 | Exceptional $129,979 |
| Immigrants | Ireland | 100.0 /100 | #10 | Exceptional $127,584 |
| Immigrants | Israel | 100.0 /100 | #11 | Exceptional $127,430 |
| Cypriots | 100.0 /100 | #12 | Exceptional $127,064 |
| Immigrants | Australia | 100.0 /100 | #13 | Exceptional $126,620 |
| Immigrants | South Central Asia | 100.0 /100 | #14 | Exceptional $125,956 |
| Eastern Europeans | 100.0 /100 | #15 | Exceptional $125,546 |
| Immigrants | China | 100.0 /100 | #16 | Exceptional $125,540 |
| Indians (Asian) | 100.0 /100 | #17 | Exceptional $125,312 |
| Immigrants | Eastern Asia | 100.0 /100 | #18 | Exceptional $125,150 |
| Immigrants | Belgium | 100.0 /100 | #19 | Exceptional $123,831 |
| Burmese | 100.0 /100 | #20 | Exceptional $123,369 |
| Immigrants | Korea | 100.0 /100 | #21 | Exceptional $122,800 |
| Immigrants | Sweden | 100.0 /100 | #22 | Exceptional $122,765 |
| Immigrants | Japan | 100.0 /100 | #23 | Exceptional $122,764 |
| Immigrants | Northern Europe | 100.0 /100 | #24 | Exceptional $121,840 |
| Turks | 100.0 /100 | #25 | Exceptional $121,202 |
| Immigrants | Switzerland | 100.0 /100 | #26 | Exceptional $120,726 |
| Russians | 100.0 /100 | #27 | Exceptional $120,487 |