Russian vs Hungarian Male Poverty
COMPARE
Russian
Hungarian
Male Poverty
Male Poverty Comparison
Russians
Hungarians
9.9%
MALE POVERTY
99.2/ 100
METRIC RATING
39th/ 347
METRIC RANK
11.1%
MALE POVERTY
55.1/ 100
METRIC RATING
167th/ 347
METRIC RANK
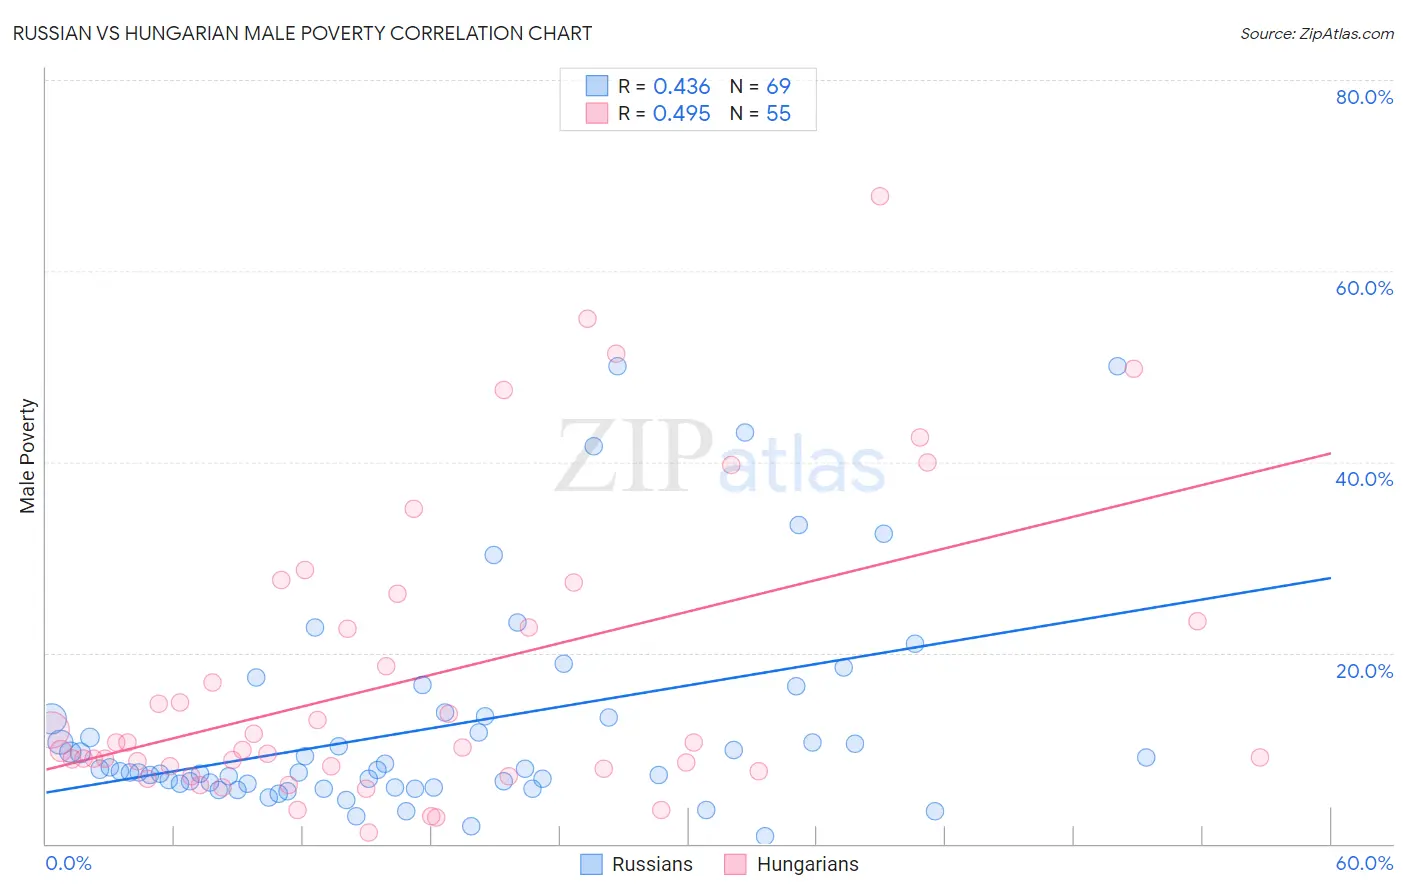
Russian vs Hungarian Male Poverty Correlation Chart
The statistical analysis conducted on geographies consisting of 511,199,815 people shows a moderate positive correlation between the proportion of Russians and poverty level among males in the United States with a correlation coefficient (R) of 0.436 and weighted average of 9.9%. Similarly, the statistical analysis conducted on geographies consisting of 485,483,073 people shows a moderate positive correlation between the proportion of Hungarians and poverty level among males in the United States with a correlation coefficient (R) of 0.495 and weighted average of 11.1%, a difference of 12.9%.
Male Poverty Correlation Summary
| Measurement | Russian | Hungarian |
| Minimum | 0.81% | 1.2% |
| Maximum | 50.0% | 67.8% |
| Range | 49.2% | 66.6% |
| Mean | 12.1% | 17.3% |
| Median | 7.7% | 10.1% |
| Interquartile 25% (IQ1) | 6.1% | 7.8% |
| Interquartile 75% (IQ3) | 13.3% | 23.3% |
| Interquartile Range (IQR) | 7.2% | 15.4% |
| Standard Deviation (Sample) | 10.8% | 15.4% |
| Standard Deviation (Population) | 10.8% | 15.3% |
Similar Demographics by Male Poverty
Demographics Similar to Russians by Male Poverty
In terms of male poverty, the demographic groups most similar to Russians are Immigrants from Pakistan (9.9%, a difference of 0.010%), Cypriot (9.9%, a difference of 0.080%), Korean (9.9%, a difference of 0.17%), Immigrants from Greece (9.8%, a difference of 0.38%), and Immigrants from Iran (9.9%, a difference of 0.42%).
| Demographics | Rating | Rank | Male Poverty |
| Macedonians | 99.5 /100 | #32 | Exceptional 9.7% |
| Immigrants | Northern Europe | 99.5 /100 | #33 | Exceptional 9.7% |
| Immigrants | Poland | 99.5 /100 | #34 | Exceptional 9.8% |
| Iranians | 99.4 /100 | #35 | Exceptional 9.8% |
| Czechs | 99.4 /100 | #36 | Exceptional 9.8% |
| Immigrants | Greece | 99.3 /100 | #37 | Exceptional 9.8% |
| Immigrants | Pakistan | 99.2 /100 | #38 | Exceptional 9.9% |
| Russians | 99.2 /100 | #39 | Exceptional 9.9% |
| Cypriots | 99.2 /100 | #40 | Exceptional 9.9% |
| Koreans | 99.2 /100 | #41 | Exceptional 9.9% |
| Immigrants | Iran | 99.1 /100 | #42 | Exceptional 9.9% |
| Immigrants | Moldova | 99.0 /100 | #43 | Exceptional 9.9% |
| Immigrants | Romania | 98.9 /100 | #44 | Exceptional 9.9% |
| Immigrants | Serbia | 98.9 /100 | #45 | Exceptional 10.0% |
| Turks | 98.9 /100 | #46 | Exceptional 10.0% |
Demographics Similar to Hungarians by Male Poverty
In terms of male poverty, the demographic groups most similar to Hungarians are Immigrants from Albania (11.1%, a difference of 0.020%), Immigrants from Portugal (11.1%, a difference of 0.020%), Immigrants from Spain (11.1%, a difference of 0.040%), Immigrants from Colombia (11.1%, a difference of 0.090%), and South American (11.1%, a difference of 0.14%).
| Demographics | Rating | Rank | Male Poverty |
| Soviet Union | 60.3 /100 | #160 | Good 11.1% |
| Immigrants | Northern Africa | 59.7 /100 | #161 | Average 11.1% |
| Immigrants | Chile | 57.4 /100 | #162 | Average 11.1% |
| Whites/Caucasians | 56.7 /100 | #163 | Average 11.1% |
| Ethiopians | 56.7 /100 | #164 | Average 11.1% |
| Immigrants | Spain | 55.5 /100 | #165 | Average 11.1% |
| Immigrants | Albania | 55.3 /100 | #166 | Average 11.1% |
| Hungarians | 55.1 /100 | #167 | Average 11.1% |
| Immigrants | Portugal | 54.9 /100 | #168 | Average 11.1% |
| Immigrants | Colombia | 54.2 /100 | #169 | Average 11.1% |
| South Americans | 53.8 /100 | #170 | Average 11.1% |
| Uruguayans | 51.0 /100 | #171 | Average 11.2% |
| Immigrants | Ethiopia | 50.7 /100 | #172 | Average 11.2% |
| Pennsylvania Germans | 50.5 /100 | #173 | Average 11.2% |
| Immigrants | Oceania | 50.0 /100 | #174 | Average 11.2% |