Houma vs Immigrants from Israel Child Poverty Under the Age of 5
COMPARE
Houma
Immigrants from Israel
Child Poverty Under the Age of 5
Child Poverty Under the Age of 5 Comparison
Houma
Immigrants from Israel
22.7%
CHILD POVERTY UNDER THE AGE OF 5
0.0/ 100
METRIC RATING
309th/ 347
METRIC RANK
14.9%
CHILD POVERTY UNDER THE AGE OF 5
99.4/ 100
METRIC RATING
54th/ 347
METRIC RANK
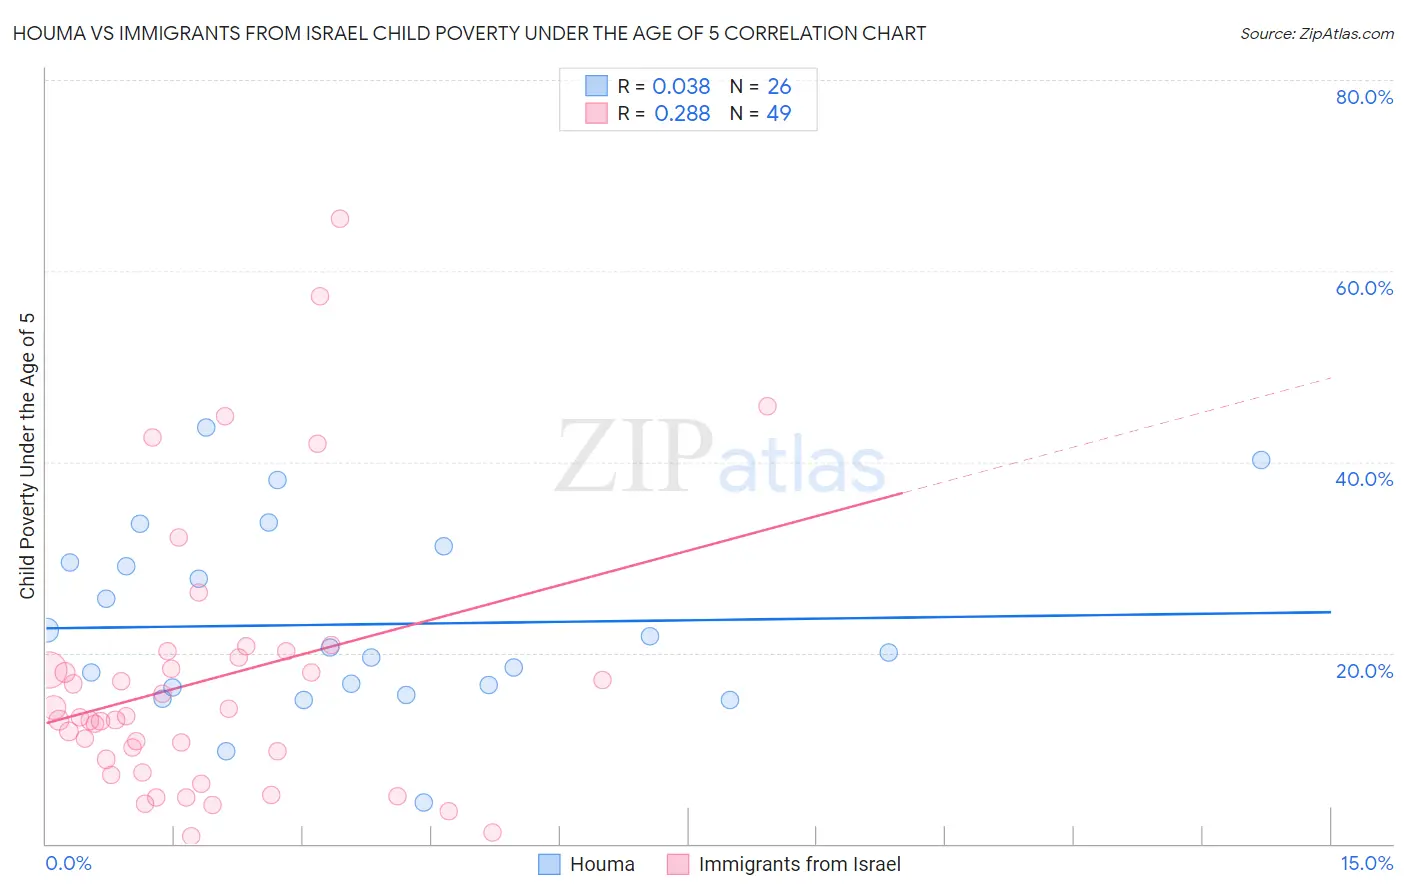
Houma vs Immigrants from Israel Child Poverty Under the Age of 5 Correlation Chart
The statistical analysis conducted on geographies consisting of 36,619,572 people shows no correlation between the proportion of Houma and poverty level among children under the age of 5 in the United States with a correlation coefficient (R) of 0.038 and weighted average of 22.7%. Similarly, the statistical analysis conducted on geographies consisting of 202,374,512 people shows a weak positive correlation between the proportion of Immigrants from Israel and poverty level among children under the age of 5 in the United States with a correlation coefficient (R) of 0.288 and weighted average of 14.9%, a difference of 52.3%.
Child Poverty Under the Age of 5 Correlation Summary
| Measurement | Houma | Immigrants from Israel |
| Minimum | 4.3% | 0.72% |
| Maximum | 43.6% | 65.4% |
| Range | 39.3% | 64.7% |
| Mean | 23.0% | 17.2% |
| Median | 20.3% | 13.3% |
| Interquartile 25% (IQ1) | 16.3% | 8.1% |
| Interquartile 75% (IQ3) | 29.4% | 19.9% |
| Interquartile Range (IQR) | 13.1% | 11.7% |
| Standard Deviation (Sample) | 9.6% | 14.1% |
| Standard Deviation (Population) | 9.4% | 14.0% |
Similar Demographics by Child Poverty Under the Age of 5
Demographics Similar to Houma by Child Poverty Under the Age of 5
In terms of child poverty under the age of 5, the demographic groups most similar to Houma are Immigrants from Dominica (22.7%, a difference of 0.14%), Immigrants from Bahamas (22.7%, a difference of 0.18%), African (22.8%, a difference of 0.41%), Seminole (22.8%, a difference of 0.45%), and Honduran (23.0%, a difference of 1.1%).
| Demographics | Rating | Rank | Child Poverty Under the Age of 5 |
| Iroquois | 0.0 /100 | #302 | Tragic 22.0% |
| Inupiat | 0.0 /100 | #303 | Tragic 22.0% |
| Immigrants | Guatemala | 0.0 /100 | #304 | Tragic 22.0% |
| Immigrants | Mexico | 0.0 /100 | #305 | Tragic 22.2% |
| Indonesians | 0.0 /100 | #306 | Tragic 22.3% |
| Immigrants | Bahamas | 0.0 /100 | #307 | Tragic 22.7% |
| Immigrants | Dominica | 0.0 /100 | #308 | Tragic 22.7% |
| Houma | 0.0 /100 | #309 | Tragic 22.7% |
| Africans | 0.0 /100 | #310 | Tragic 22.8% |
| Seminole | 0.0 /100 | #311 | Tragic 22.8% |
| Hondurans | 0.0 /100 | #312 | Tragic 23.0% |
| Bahamians | 0.0 /100 | #313 | Tragic 23.0% |
| U.S. Virgin Islanders | 0.0 /100 | #314 | Tragic 23.0% |
| Arapaho | 0.0 /100 | #315 | Tragic 23.1% |
| Yakama | 0.0 /100 | #316 | Tragic 23.1% |
Demographics Similar to Immigrants from Israel by Child Poverty Under the Age of 5
In terms of child poverty under the age of 5, the demographic groups most similar to Immigrants from Israel are Luxembourger (14.9%, a difference of 0.0%), Danish (14.9%, a difference of 0.060%), Immigrants from Pakistan (14.9%, a difference of 0.13%), Immigrants from Serbia (14.9%, a difference of 0.17%), and Egyptian (14.9%, a difference of 0.21%).
| Demographics | Rating | Rank | Child Poverty Under the Age of 5 |
| Russians | 99.6 /100 | #47 | Exceptional 14.8% |
| Immigrants | Czechoslovakia | 99.6 /100 | #48 | Exceptional 14.8% |
| Immigrants | Bulgaria | 99.6 /100 | #49 | Exceptional 14.8% |
| Immigrants | Northern Europe | 99.6 /100 | #50 | Exceptional 14.8% |
| Estonians | 99.6 /100 | #51 | Exceptional 14.8% |
| Immigrants | Serbia | 99.5 /100 | #52 | Exceptional 14.9% |
| Luxembourgers | 99.4 /100 | #53 | Exceptional 14.9% |
| Immigrants | Israel | 99.4 /100 | #54 | Exceptional 14.9% |
| Danes | 99.4 /100 | #55 | Exceptional 14.9% |
| Immigrants | Pakistan | 99.4 /100 | #56 | Exceptional 14.9% |
| Egyptians | 99.4 /100 | #57 | Exceptional 14.9% |
| Swedes | 99.4 /100 | #58 | Exceptional 15.0% |
| Paraguayans | 99.4 /100 | #59 | Exceptional 15.0% |
| Immigrants | Russia | 99.3 /100 | #60 | Exceptional 15.0% |
| Immigrants | Poland | 99.1 /100 | #61 | Exceptional 15.1% |