Puget Sound Salish vs Immigrants from Israel Single Mother Households
COMPARE
Puget Sound Salish
Immigrants from Israel
Single Mother Households
Single Mother Households Comparison
Puget Sound Salish
Immigrants from Israel
6.3%
SINGLE MOTHER HOUSEHOLDS
58.1/ 100
METRIC RATING
169th/ 347
METRIC RANK
5.0%
SINGLE MOTHER HOUSEHOLDS
99.9/ 100
METRIC RATING
10th/ 347
METRIC RANK
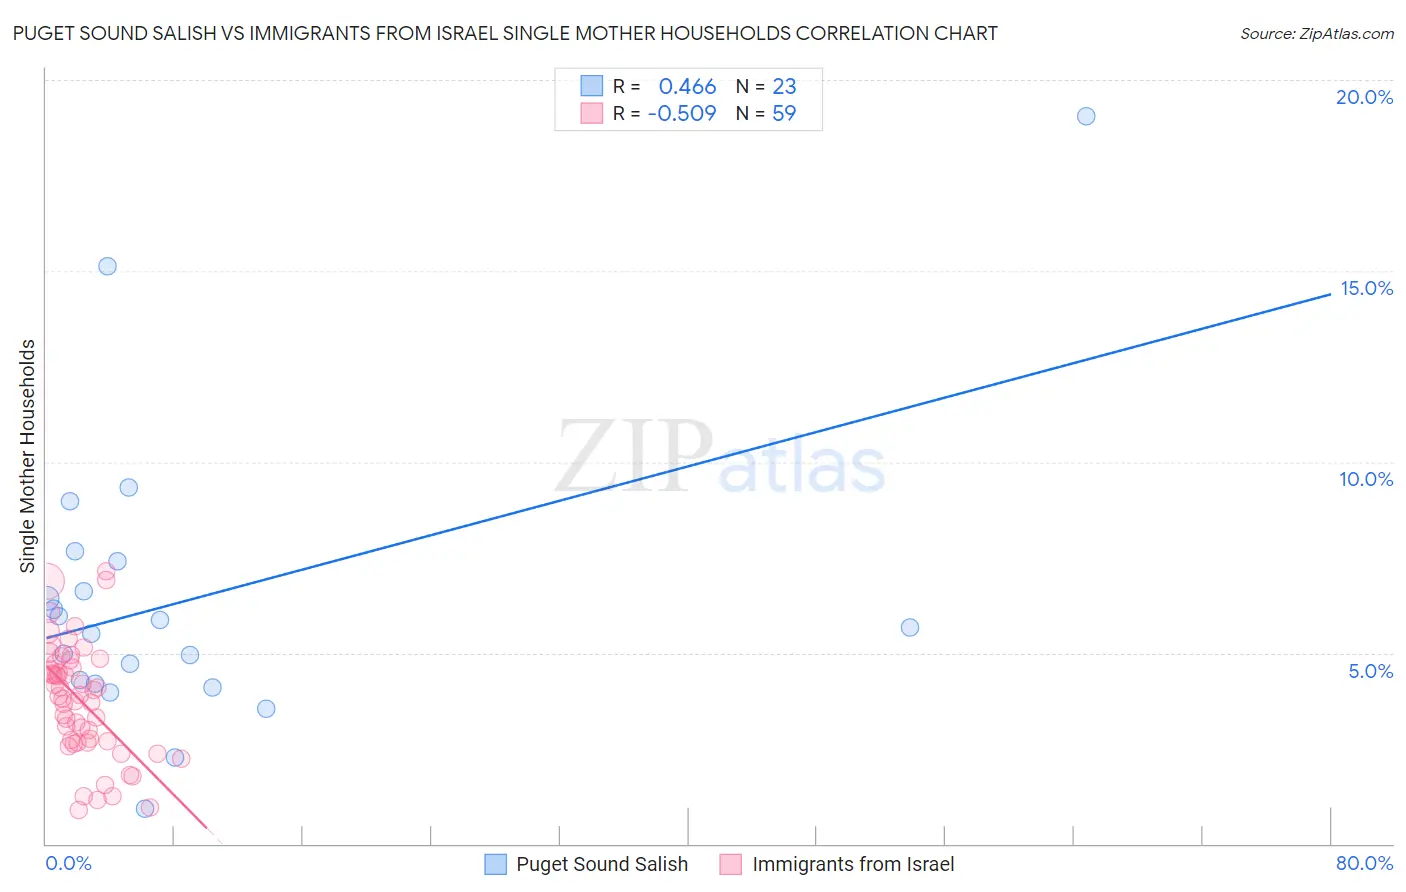
Puget Sound Salish vs Immigrants from Israel Single Mother Households Correlation Chart
The statistical analysis conducted on geographies consisting of 46,127,727 people shows a moderate positive correlation between the proportion of Puget Sound Salish and percentage of single mother households in the United States with a correlation coefficient (R) of 0.466 and weighted average of 6.3%. Similarly, the statistical analysis conducted on geographies consisting of 209,589,874 people shows a substantial negative correlation between the proportion of Immigrants from Israel and percentage of single mother households in the United States with a correlation coefficient (R) of -0.509 and weighted average of 5.0%, a difference of 24.4%.
Single Mother Households Correlation Summary
| Measurement | Puget Sound Salish | Immigrants from Israel |
| Minimum | 0.93% | 0.87% |
| Maximum | 19.0% | 7.1% |
| Range | 18.1% | 6.3% |
| Mean | 6.4% | 3.7% |
| Median | 5.7% | 3.9% |
| Interquartile 25% (IQ1) | 4.2% | 2.7% |
| Interquartile 75% (IQ3) | 7.4% | 4.7% |
| Interquartile Range (IQR) | 3.2% | 2.0% |
| Standard Deviation (Sample) | 3.9% | 1.5% |
| Standard Deviation (Population) | 3.8% | 1.5% |
Similar Demographics by Single Mother Households
Demographics Similar to Puget Sound Salish by Single Mother Households
In terms of single mother households, the demographic groups most similar to Puget Sound Salish are Immigrants from Chile (6.3%, a difference of 0.020%), Brazilian (6.2%, a difference of 0.11%), Immigrants from Oceania (6.3%, a difference of 0.40%), Afghan (6.3%, a difference of 0.63%), and Immigrants from South Eastern Asia (6.3%, a difference of 0.66%).
| Demographics | Rating | Rank | Single Mother Households |
| Immigrants | Zimbabwe | 69.9 /100 | #162 | Good 6.2% |
| Alsatians | 68.7 /100 | #163 | Good 6.2% |
| Immigrants | Northern Africa | 68.0 /100 | #164 | Good 6.2% |
| Immigrants | Syria | 67.4 /100 | #165 | Good 6.2% |
| Sri Lankans | 63.9 /100 | #166 | Good 6.2% |
| Brazilians | 59.1 /100 | #167 | Average 6.2% |
| Immigrants | Chile | 58.3 /100 | #168 | Average 6.3% |
| Puget Sound Salish | 58.1 /100 | #169 | Average 6.3% |
| Immigrants | Oceania | 54.6 /100 | #170 | Average 6.3% |
| Afghans | 52.5 /100 | #171 | Average 6.3% |
| Immigrants | South Eastern Asia | 52.2 /100 | #172 | Average 6.3% |
| Immigrants | Vietnam | 51.5 /100 | #173 | Average 6.3% |
| Immigrants | Morocco | 50.0 /100 | #174 | Average 6.3% |
| Marshallese | 45.8 /100 | #175 | Average 6.3% |
| Immigrants | Bosnia and Herzegovina | 44.3 /100 | #176 | Average 6.3% |
Demographics Similar to Immigrants from Israel by Single Mother Households
In terms of single mother households, the demographic groups most similar to Immigrants from Israel are Okinawan (5.0%, a difference of 0.34%), Immigrants from Ireland (5.0%, a difference of 0.49%), Immigrants from China (5.1%, a difference of 0.63%), Cypriot (5.1%, a difference of 0.81%), and Immigrants from India (5.1%, a difference of 0.94%).
| Demographics | Rating | Rank | Single Mother Households |
| Immigrants | Iran | 100.0 /100 | #3 | Exceptional 4.8% |
| Assyrians/Chaldeans/Syriacs | 100.0 /100 | #4 | Exceptional 4.8% |
| Immigrants | Hong Kong | 100.0 /100 | #5 | Exceptional 4.8% |
| Immigrants | Singapore | 100.0 /100 | #6 | Exceptional 5.0% |
| Iranians | 100.0 /100 | #7 | Exceptional 5.0% |
| Immigrants | Ireland | 99.9 /100 | #8 | Exceptional 5.0% |
| Okinawans | 99.9 /100 | #9 | Exceptional 5.0% |
| Immigrants | Israel | 99.9 /100 | #10 | Exceptional 5.0% |
| Immigrants | China | 99.9 /100 | #11 | Exceptional 5.1% |
| Cypriots | 99.9 /100 | #12 | Exceptional 5.1% |
| Immigrants | India | 99.9 /100 | #13 | Exceptional 5.1% |
| Immigrants | Australia | 99.9 /100 | #14 | Exceptional 5.1% |
| Immigrants | Eastern Asia | 99.9 /100 | #15 | Exceptional 5.1% |
| Indians (Asian) | 99.9 /100 | #16 | Exceptional 5.1% |
| Soviet Union | 99.9 /100 | #17 | Exceptional 5.1% |