Alsatian vs Immigrants from the Azores Male Poverty
COMPARE
Alsatian
Immigrants from the Azores
Male Poverty
Male Poverty Comparison
Alsatians
Immigrants from the Azores
12.4%
MALE POVERTY
1.3/ 100
METRIC RATING
228th/ 347
METRIC RANK
12.0%
MALE POVERTY
4.3/ 100
METRIC RATING
209th/ 347
METRIC RANK
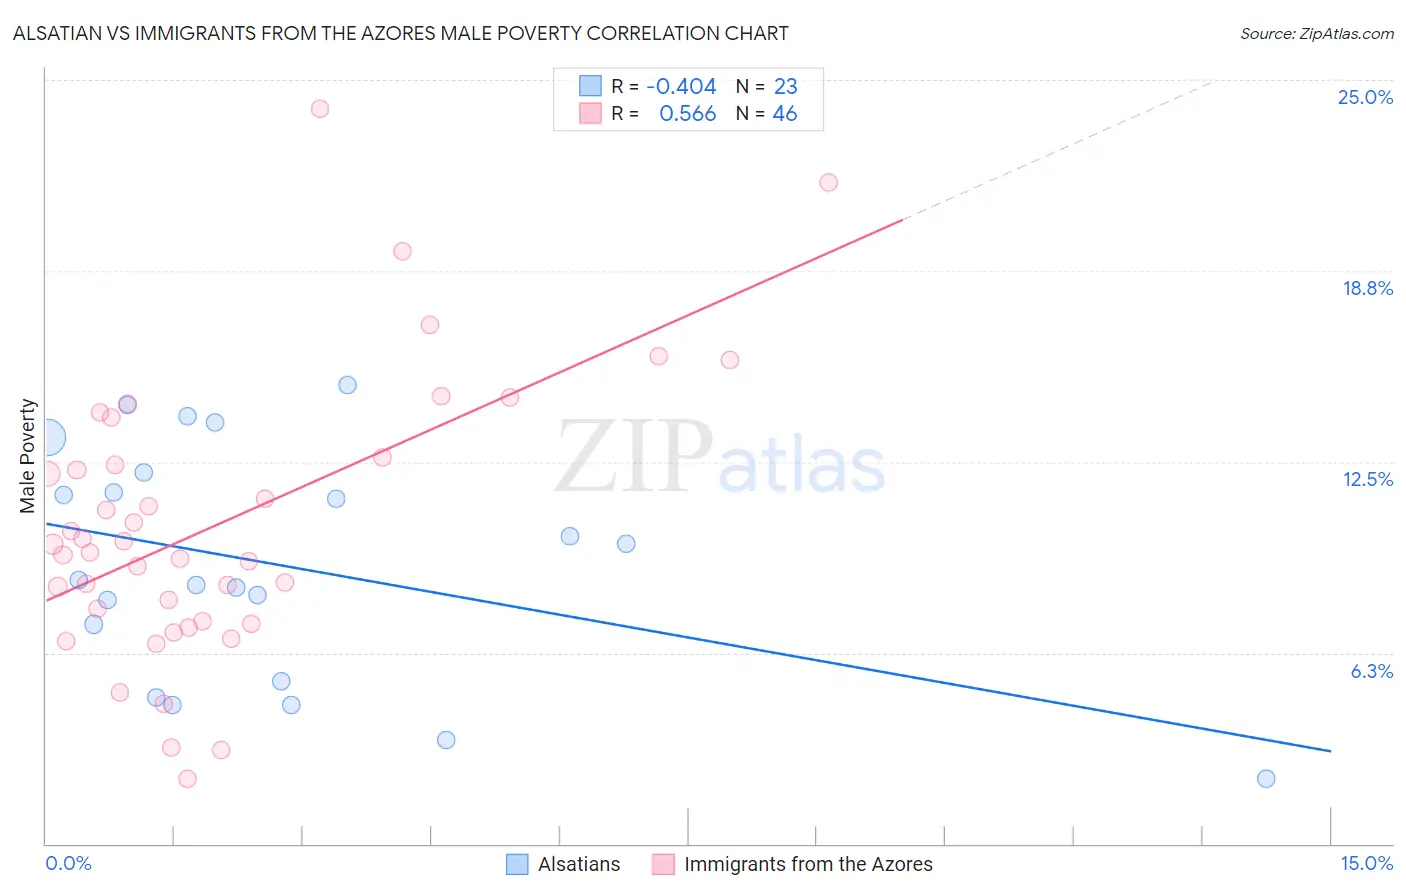
Alsatian vs Immigrants from the Azores Male Poverty Correlation Chart
The statistical analysis conducted on geographies consisting of 82,673,926 people shows a moderate negative correlation between the proportion of Alsatians and poverty level among males in the United States with a correlation coefficient (R) of -0.404 and weighted average of 12.4%. Similarly, the statistical analysis conducted on geographies consisting of 46,252,452 people shows a substantial positive correlation between the proportion of Immigrants from the Azores and poverty level among males in the United States with a correlation coefficient (R) of 0.566 and weighted average of 12.0%, a difference of 2.7%.
Male Poverty Correlation Summary
| Measurement | Alsatian | Immigrants from the Azores |
| Minimum | 2.1% | 2.1% |
| Maximum | 15.0% | 24.1% |
| Range | 12.9% | 21.9% |
| Mean | 9.1% | 10.5% |
| Median | 8.6% | 9.7% |
| Interquartile 25% (IQ1) | 5.3% | 7.3% |
| Interquartile 75% (IQ3) | 12.2% | 12.7% |
| Interquartile Range (IQR) | 6.9% | 5.4% |
| Standard Deviation (Sample) | 3.8% | 4.6% |
| Standard Deviation (Population) | 3.7% | 4.5% |
Demographics Similar to Alsatians and Immigrants from the Azores by Male Poverty
In terms of male poverty, the demographic groups most similar to Alsatians are Alaska Native (12.4%, a difference of 0.040%), Nigerian (12.3%, a difference of 0.13%), Osage (12.3%, a difference of 0.30%), Immigrants from Nigeria (12.3%, a difference of 0.36%), and Immigrants from Micronesia (12.2%, a difference of 1.0%). Similarly, the demographic groups most similar to Immigrants from the Azores are Moroccan (12.0%, a difference of 0.050%), Immigrants (12.0%, a difference of 0.12%), Immigrants from Panama (12.1%, a difference of 0.17%), American (12.1%, a difference of 0.73%), and Nonimmigrants (12.1%, a difference of 0.77%).
| Demographics | Rating | Rank | Male Poverty |
| Immigrants | Immigrants | 4.5 /100 | #208 | Tragic 12.0% |
| Immigrants | Azores | 4.3 /100 | #209 | Tragic 12.0% |
| Moroccans | 4.2 /100 | #210 | Tragic 12.0% |
| Immigrants | Panama | 4.0 /100 | #211 | Tragic 12.1% |
| Americans | 3.2 /100 | #212 | Tragic 12.1% |
| Immigrants | Nonimmigrants | 3.1 /100 | #213 | Tragic 12.1% |
| Japanese | 2.7 /100 | #214 | Tragic 12.2% |
| Immigrants | Uzbekistan | 2.6 /100 | #215 | Tragic 12.2% |
| Immigrants | Cambodia | 2.5 /100 | #216 | Tragic 12.2% |
| Immigrants | Thailand | 2.5 /100 | #217 | Tragic 12.2% |
| German Russians | 2.5 /100 | #218 | Tragic 12.2% |
| Bermudans | 2.4 /100 | #219 | Tragic 12.2% |
| Immigrants | Eritrea | 2.4 /100 | #220 | Tragic 12.2% |
| Ugandans | 2.2 /100 | #221 | Tragic 12.2% |
| Immigrants | Africa | 2.1 /100 | #222 | Tragic 12.2% |
| Immigrants | Micronesia | 2.1 /100 | #223 | Tragic 12.2% |
| Immigrants | Nigeria | 1.6 /100 | #224 | Tragic 12.3% |
| Osage | 1.5 /100 | #225 | Tragic 12.3% |
| Nigerians | 1.4 /100 | #226 | Tragic 12.3% |
| Alaska Natives | 1.4 /100 | #227 | Tragic 12.4% |
| Alsatians | 1.3 /100 | #228 | Tragic 12.4% |