Puget Sound Salish vs Immigrants from the Azores Hearing Disability
COMPARE
Puget Sound Salish
Immigrants from the Azores
Hearing Disability
Hearing Disability Comparison
Puget Sound Salish
Immigrants from the Azores
3.9%
HEARING DISABILITY
0.0/ 100
METRIC RATING
315th/ 347
METRIC RANK
3.7%
HEARING DISABILITY
0.0/ 100
METRIC RATING
297th/ 347
METRIC RANK
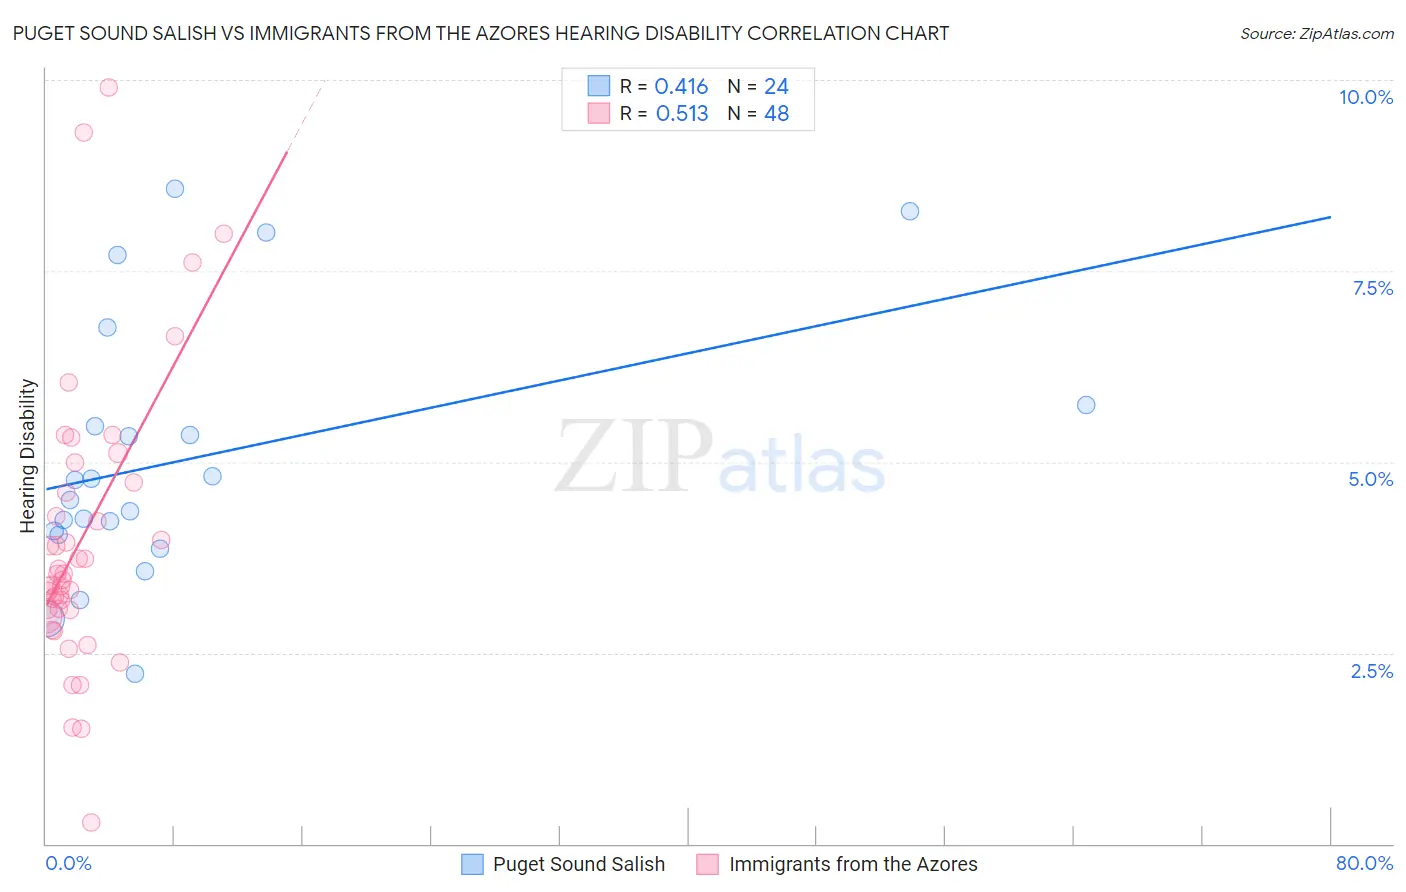
Puget Sound Salish vs Immigrants from the Azores Hearing Disability Correlation Chart
The statistical analysis conducted on geographies consisting of 46,152,047 people shows a moderate positive correlation between the proportion of Puget Sound Salish and percentage of population with hearing disability in the United States with a correlation coefficient (R) of 0.416 and weighted average of 3.9%. Similarly, the statistical analysis conducted on geographies consisting of 46,255,123 people shows a substantial positive correlation between the proportion of Immigrants from the Azores and percentage of population with hearing disability in the United States with a correlation coefficient (R) of 0.513 and weighted average of 3.7%, a difference of 6.3%.
Hearing Disability Correlation Summary
| Measurement | Puget Sound Salish | Immigrants from the Azores |
| Minimum | 2.2% | 0.28% |
| Maximum | 8.6% | 9.9% |
| Range | 6.3% | 9.6% |
| Mean | 5.0% | 4.0% |
| Median | 4.6% | 3.5% |
| Interquartile 25% (IQ1) | 4.1% | 3.1% |
| Interquartile 75% (IQ3) | 5.6% | 4.7% |
| Interquartile Range (IQR) | 1.5% | 1.6% |
| Standard Deviation (Sample) | 1.7% | 1.9% |
| Standard Deviation (Population) | 1.7% | 1.9% |
Demographics Similar to Puget Sound Salish and Immigrants from the Azores by Hearing Disability
In terms of hearing disability, the demographic groups most similar to Puget Sound Salish are Yakama (3.9%, a difference of 0.010%), Hopi (3.9%, a difference of 0.18%), Spanish American (4.0%, a difference of 0.20%), Cajun (3.9%, a difference of 0.29%), and American (3.9%, a difference of 1.4%). Similarly, the demographic groups most similar to Immigrants from the Azores are Pima (3.7%, a difference of 0.070%), Celtic (3.7%, a difference of 0.19%), German (3.7%, a difference of 0.47%), Scottish (3.7%, a difference of 0.53%), and Pennsylvania German (3.7%, a difference of 0.56%).
| Demographics | Rating | Rank | Hearing Disability |
| Pima | 0.0 /100 | #296 | Tragic 3.7% |
| Immigrants | Azores | 0.0 /100 | #297 | Tragic 3.7% |
| Celtics | 0.0 /100 | #298 | Tragic 3.7% |
| Germans | 0.0 /100 | #299 | Tragic 3.7% |
| Scottish | 0.0 /100 | #300 | Tragic 3.7% |
| Pennsylvania Germans | 0.0 /100 | #301 | Tragic 3.7% |
| Dutch | 0.0 /100 | #302 | Tragic 3.7% |
| Menominee | 0.0 /100 | #303 | Tragic 3.7% |
| French | 0.0 /100 | #304 | Tragic 3.8% |
| English | 0.0 /100 | #305 | Tragic 3.8% |
| Marshallese | 0.0 /100 | #306 | Tragic 3.8% |
| French Canadians | 0.0 /100 | #307 | Tragic 3.8% |
| Ottawa | 0.0 /100 | #308 | Tragic 3.8% |
| Scotch-Irish | 0.0 /100 | #309 | Tragic 3.8% |
| Cree | 0.0 /100 | #310 | Tragic 3.8% |
| Americans | 0.0 /100 | #311 | Tragic 3.9% |
| Cajuns | 0.0 /100 | #312 | Tragic 3.9% |
| Hopi | 0.0 /100 | #313 | Tragic 3.9% |
| Yakama | 0.0 /100 | #314 | Tragic 3.9% |
| Puget Sound Salish | 0.0 /100 | #315 | Tragic 3.9% |
| Spanish Americans | 0.0 /100 | #316 | Tragic 4.0% |