Puerto Rican vs Immigrants from China Child Poverty Among Boys Under 16
COMPARE
Puerto Rican
Immigrants from China
Child Poverty Among Boys Under 16
Child Poverty Among Boys Under 16 Comparison
Puerto Ricans
Immigrants from China
32.8%
CHILD POVERTY AMONG BOYS UNDER 16
0.0/ 100
METRIC RATING
347th/ 347
METRIC RANK
13.6%
CHILD POVERTY AMONG BOYS UNDER 16
99.8/ 100
METRIC RATING
32nd/ 347
METRIC RANK
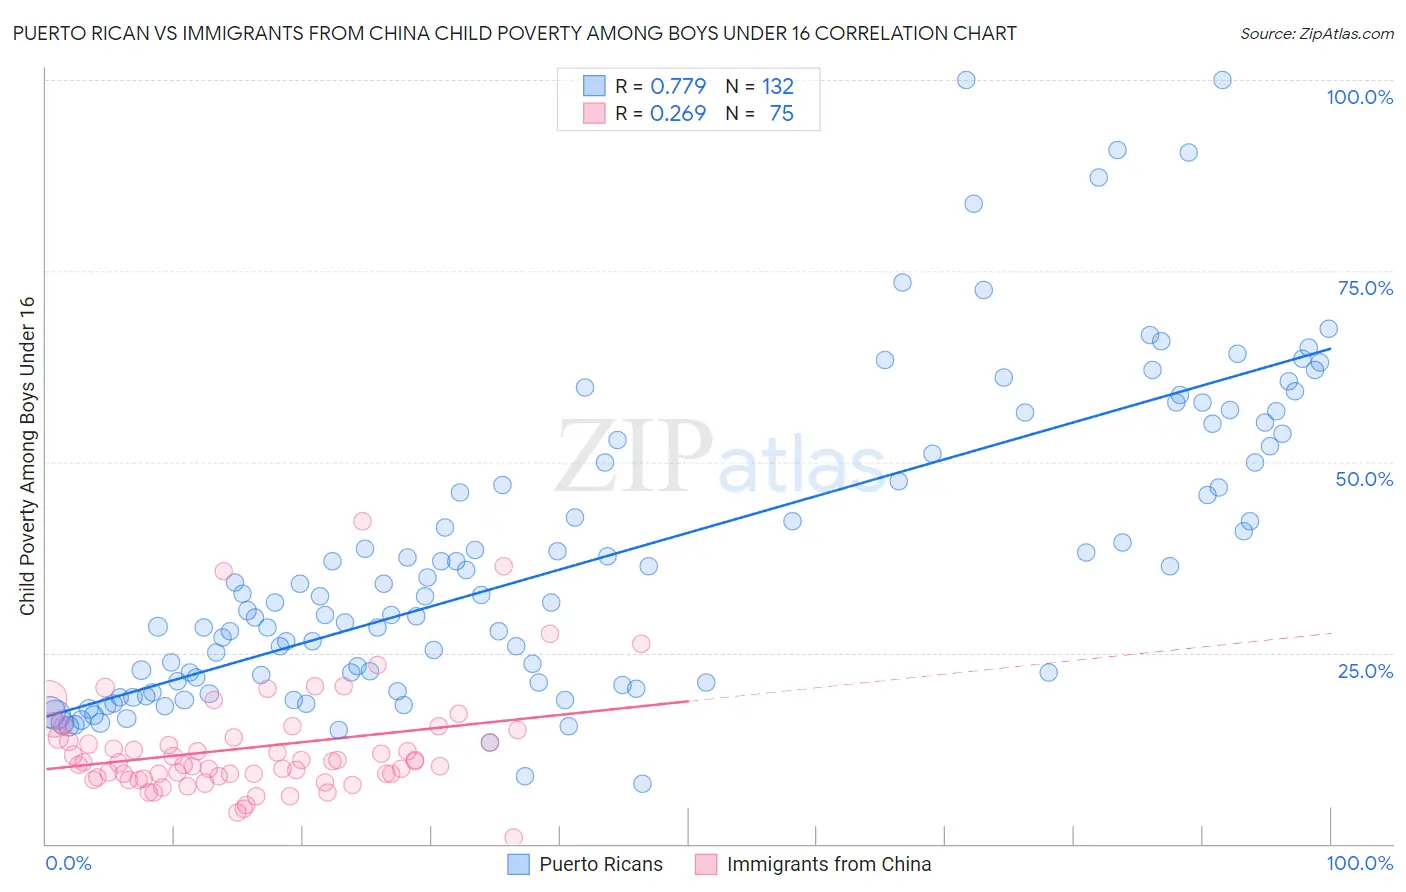
Puerto Rican vs Immigrants from China Child Poverty Among Boys Under 16 Correlation Chart
The statistical analysis conducted on geographies consisting of 514,590,520 people shows a strong positive correlation between the proportion of Puerto Ricans and poverty level among boys under the age of 16 in the United States with a correlation coefficient (R) of 0.779 and weighted average of 32.8%. Similarly, the statistical analysis conducted on geographies consisting of 446,614,379 people shows a weak positive correlation between the proportion of Immigrants from China and poverty level among boys under the age of 16 in the United States with a correlation coefficient (R) of 0.269 and weighted average of 13.6%, a difference of 141.7%.
Child Poverty Among Boys Under 16 Correlation Summary
| Measurement | Puerto Rican | Immigrants from China |
| Minimum | 7.9% | 0.83% |
| Maximum | 100.0% | 42.3% |
| Range | 92.1% | 41.4% |
| Mean | 37.5% | 12.6% |
| Median | 32.4% | 10.7% |
| Interquartile 25% (IQ1) | 21.2% | 8.6% |
| Interquartile 75% (IQ3) | 51.6% | 13.9% |
| Interquartile Range (IQR) | 30.4% | 5.3% |
| Standard Deviation (Sample) | 20.1% | 7.2% |
| Standard Deviation (Population) | 20.0% | 7.1% |
Similar Demographics by Child Poverty Among Boys Under 16
Demographics Similar to Puerto Ricans by Child Poverty Among Boys Under 16
In terms of child poverty among boys under 16, the demographic groups most similar to Puerto Ricans are Lumbee (31.9%, a difference of 2.9%), Tohono O'odham (31.6%, a difference of 4.1%), Yuman (30.6%, a difference of 7.2%), Navajo (30.3%, a difference of 8.4%), and Pima (29.7%, a difference of 10.4%).
| Demographics | Rating | Rank | Child Poverty Among Boys Under 16 |
| Apache | 0.0 /100 | #333 | Tragic 24.5% |
| Blacks/African Americans | 0.0 /100 | #334 | Tragic 24.5% |
| Yup'ik | 0.0 /100 | #335 | Tragic 24.7% |
| Sioux | 0.0 /100 | #336 | Tragic 25.3% |
| Cheyenne | 0.0 /100 | #337 | Tragic 25.8% |
| Hopi | 0.0 /100 | #338 | Tragic 25.9% |
| Houma | 0.0 /100 | #339 | Tragic 26.2% |
| Crow | 0.0 /100 | #340 | Tragic 26.3% |
| Immigrants | Yemen | 0.0 /100 | #341 | Tragic 28.9% |
| Pima | 0.0 /100 | #342 | Tragic 29.7% |
| Navajo | 0.0 /100 | #343 | Tragic 30.3% |
| Yuman | 0.0 /100 | #344 | Tragic 30.6% |
| Tohono O'odham | 0.0 /100 | #345 | Tragic 31.6% |
| Lumbee | 0.0 /100 | #346 | Tragic 31.9% |
| Puerto Ricans | 0.0 /100 | #347 | Tragic 32.8% |
Demographics Similar to Immigrants from China by Child Poverty Among Boys Under 16
In terms of child poverty among boys under 16, the demographic groups most similar to Immigrants from China are Turkish (13.6%, a difference of 0.090%), Swedish (13.6%, a difference of 0.17%), Danish (13.6%, a difference of 0.18%), Cypriot (13.6%, a difference of 0.27%), and Assyrian/Chaldean/Syriac (13.6%, a difference of 0.29%).
| Demographics | Rating | Rank | Child Poverty Among Boys Under 16 |
| Okinawans | 99.8 /100 | #25 | Exceptional 13.5% |
| Immigrants | Bolivia | 99.8 /100 | #26 | Exceptional 13.5% |
| Asians | 99.8 /100 | #27 | Exceptional 13.5% |
| Eastern Europeans | 99.8 /100 | #28 | Exceptional 13.5% |
| Cypriots | 99.8 /100 | #29 | Exceptional 13.6% |
| Swedes | 99.8 /100 | #30 | Exceptional 13.6% |
| Turks | 99.8 /100 | #31 | Exceptional 13.6% |
| Immigrants | China | 99.8 /100 | #32 | Exceptional 13.6% |
| Danes | 99.8 /100 | #33 | Exceptional 13.6% |
| Assyrians/Chaldeans/Syriacs | 99.8 /100 | #34 | Exceptional 13.6% |
| Russians | 99.7 /100 | #35 | Exceptional 13.8% |
| Luxembourgers | 99.7 /100 | #36 | Exceptional 13.8% |
| Immigrants | Sri Lanka | 99.6 /100 | #37 | Exceptional 13.9% |
| Immigrants | Northern Europe | 99.6 /100 | #38 | Exceptional 13.9% |
| Immigrants | Australia | 99.6 /100 | #39 | Exceptional 13.9% |