Immigrants from Afghanistan vs Immigrants from Oceania Child Poverty Among Boys Under 16
COMPARE
Immigrants from Afghanistan
Immigrants from Oceania
Child Poverty Among Boys Under 16
Child Poverty Among Boys Under 16 Comparison
Immigrants from Afghanistan
Immigrants from Oceania
17.3%
CHILD POVERTY AMONG BOYS UNDER 16
13.7/ 100
METRIC RATING
201st/ 347
METRIC RANK
16.0%
CHILD POVERTY AMONG BOYS UNDER 16
71.3/ 100
METRIC RATING
161st/ 347
METRIC RANK
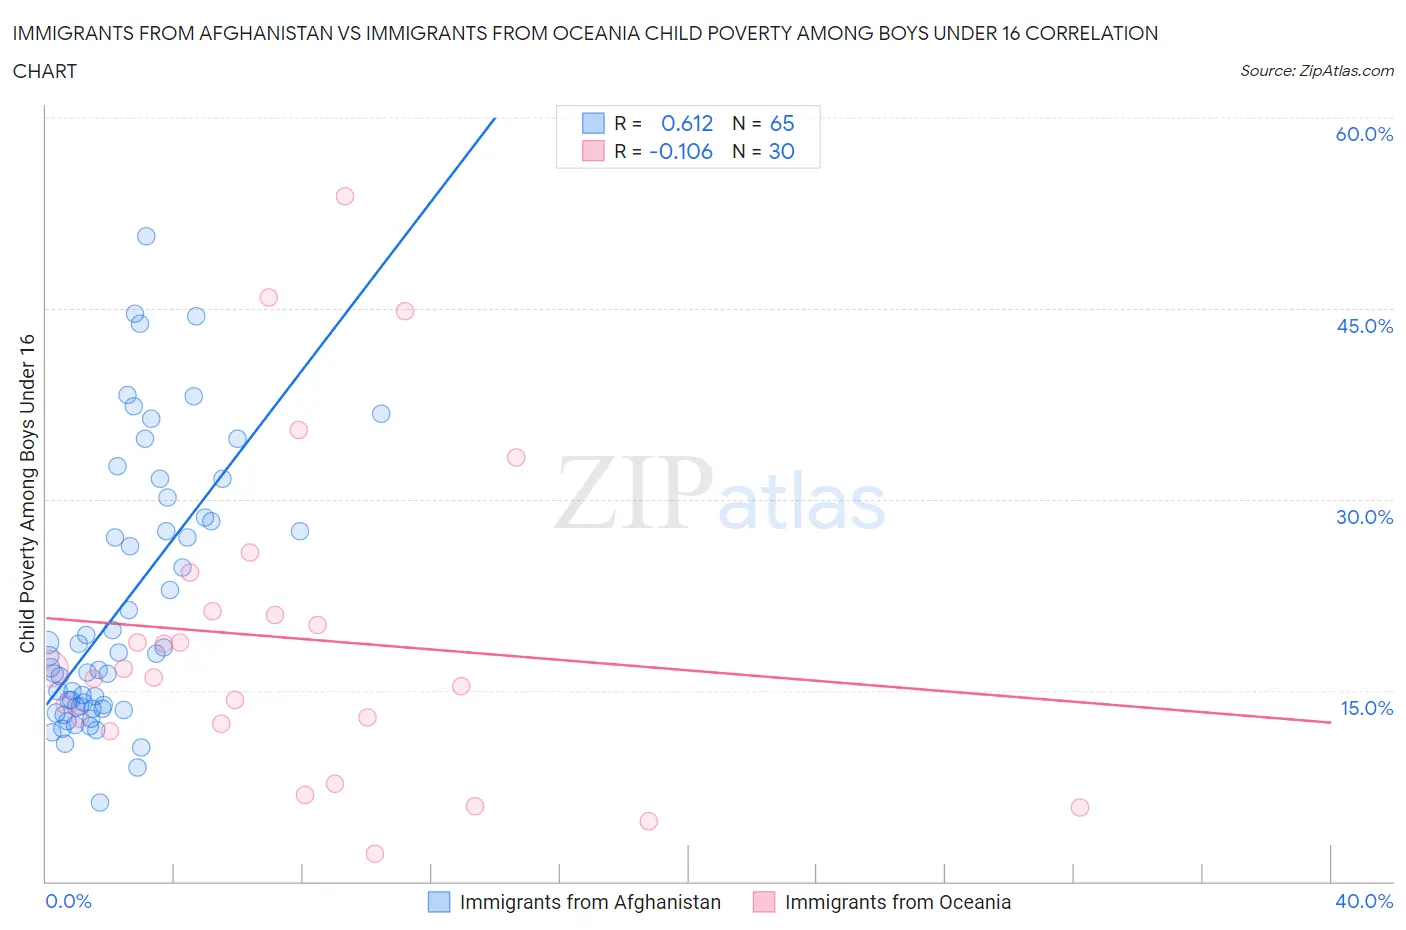
Immigrants from Afghanistan vs Immigrants from Oceania Child Poverty Among Boys Under 16 Correlation Chart
The statistical analysis conducted on geographies consisting of 146,910,651 people shows a significant positive correlation between the proportion of Immigrants from Afghanistan and poverty level among boys under the age of 16 in the United States with a correlation coefficient (R) of 0.612 and weighted average of 17.3%. Similarly, the statistical analysis conducted on geographies consisting of 301,361,436 people shows a poor negative correlation between the proportion of Immigrants from Oceania and poverty level among boys under the age of 16 in the United States with a correlation coefficient (R) of -0.106 and weighted average of 16.0%, a difference of 7.9%.
Child Poverty Among Boys Under 16 Correlation Summary
| Measurement | Immigrants from Afghanistan | Immigrants from Oceania |
| Minimum | 6.2% | 2.1% |
| Maximum | 50.7% | 53.8% |
| Range | 44.5% | 51.7% |
| Mean | 21.6% | 19.1% |
| Median | 17.7% | 16.3% |
| Interquartile 25% (IQ1) | 13.6% | 12.4% |
| Interquartile 75% (IQ3) | 28.4% | 21.2% |
| Interquartile Range (IQR) | 14.8% | 8.8% |
| Standard Deviation (Sample) | 10.5% | 12.5% |
| Standard Deviation (Population) | 10.4% | 12.3% |
Similar Demographics by Child Poverty Among Boys Under 16
Demographics Similar to Immigrants from Afghanistan by Child Poverty Among Boys Under 16
In terms of child poverty among boys under 16, the demographic groups most similar to Immigrants from Afghanistan are Immigrants from Sierra Leone (17.3%, a difference of 0.060%), Immigrants from Uzbekistan (17.3%, a difference of 0.080%), Ugandan (17.3%, a difference of 0.28%), Immigrants from Portugal (17.4%, a difference of 0.62%), and Immigrants from Uruguay (17.2%, a difference of 0.68%).
| Demographics | Rating | Rank | Child Poverty Among Boys Under 16 |
| Immigrants | Lebanon | 21.2 /100 | #194 | Fair 17.0% |
| Spanish | 20.8 /100 | #195 | Fair 17.0% |
| Spaniards | 20.5 /100 | #196 | Fair 17.1% |
| Immigrants | Kenya | 20.1 /100 | #197 | Fair 17.1% |
| Immigrants | Cameroon | 19.0 /100 | #198 | Poor 17.1% |
| Delaware | 18.8 /100 | #199 | Poor 17.1% |
| Immigrants | Uruguay | 16.9 /100 | #200 | Poor 17.2% |
| Immigrants | Afghanistan | 13.7 /100 | #201 | Poor 17.3% |
| Immigrants | Sierra Leone | 13.4 /100 | #202 | Poor 17.3% |
| Immigrants | Uzbekistan | 13.3 /100 | #203 | Poor 17.3% |
| Ugandans | 12.5 /100 | #204 | Poor 17.3% |
| Immigrants | Portugal | 11.2 /100 | #205 | Poor 17.4% |
| German Russians | 10.9 /100 | #206 | Poor 17.4% |
| Immigrants | Thailand | 8.2 /100 | #207 | Tragic 17.5% |
| Malaysians | 7.6 /100 | #208 | Tragic 17.6% |
Demographics Similar to Immigrants from Oceania by Child Poverty Among Boys Under 16
In terms of child poverty among boys under 16, the demographic groups most similar to Immigrants from Oceania are Immigrants from Northern Africa (16.0%, a difference of 0.010%), Guamanian/Chamorro (16.1%, a difference of 0.23%), Costa Rican (16.1%, a difference of 0.43%), Immigrants from Albania (16.1%, a difference of 0.45%), and Immigrants from Chile (15.9%, a difference of 0.52%).
| Demographics | Rating | Rank | Child Poverty Among Boys Under 16 |
| Syrians | 77.5 /100 | #154 | Good 15.9% |
| French Canadians | 76.6 /100 | #155 | Good 15.9% |
| Israelis | 76.5 /100 | #156 | Good 15.9% |
| Immigrants | Nepal | 76.0 /100 | #157 | Good 15.9% |
| Yugoslavians | 75.9 /100 | #158 | Good 15.9% |
| Immigrants | Chile | 74.8 /100 | #159 | Good 15.9% |
| Immigrants | Northern Africa | 71.3 /100 | #160 | Good 16.0% |
| Immigrants | Oceania | 71.3 /100 | #161 | Good 16.0% |
| Guamanians/Chamorros | 69.6 /100 | #162 | Good 16.1% |
| Costa Ricans | 68.1 /100 | #163 | Good 16.1% |
| Immigrants | Albania | 67.9 /100 | #164 | Good 16.1% |
| Colombians | 65.2 /100 | #165 | Good 16.1% |
| Immigrants | Germany | 63.6 /100 | #166 | Good 16.2% |
| Afghans | 55.4 /100 | #167 | Average 16.3% |
| South Americans | 55.3 /100 | #168 | Average 16.3% |