Puerto Rican vs French Child Poverty Among Boys Under 16
COMPARE
Puerto Rican
French
Child Poverty Among Boys Under 16
Child Poverty Among Boys Under 16 Comparison
Puerto Ricans
French
32.8%
CHILD POVERTY AMONG BOYS UNDER 16
0.0/ 100
METRIC RATING
347th/ 347
METRIC RANK
15.8%
CHILD POVERTY AMONG BOYS UNDER 16
78.7/ 100
METRIC RATING
153rd/ 347
METRIC RANK
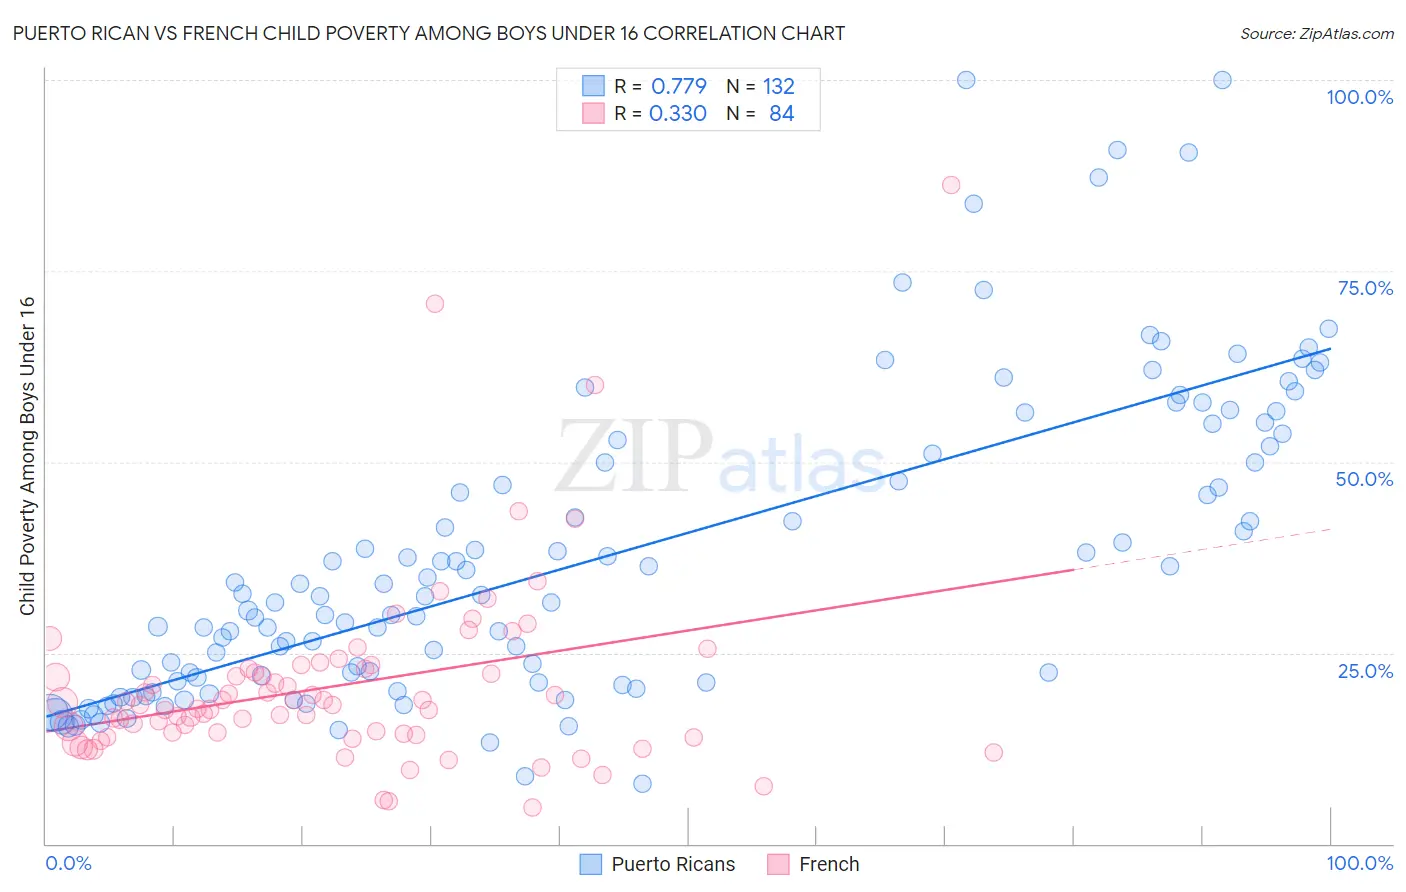
Puerto Rican vs French Child Poverty Among Boys Under 16 Correlation Chart
The statistical analysis conducted on geographies consisting of 514,590,520 people shows a strong positive correlation between the proportion of Puerto Ricans and poverty level among boys under the age of 16 in the United States with a correlation coefficient (R) of 0.779 and weighted average of 32.8%. Similarly, the statistical analysis conducted on geographies consisting of 551,366,964 people shows a mild positive correlation between the proportion of French and poverty level among boys under the age of 16 in the United States with a correlation coefficient (R) of 0.330 and weighted average of 15.8%, a difference of 107.4%.
Child Poverty Among Boys Under 16 Correlation Summary
| Measurement | Puerto Rican | French |
| Minimum | 7.9% | 4.7% |
| Maximum | 100.0% | 86.3% |
| Range | 92.1% | 81.6% |
| Mean | 37.5% | 20.7% |
| Median | 32.4% | 18.2% |
| Interquartile 25% (IQ1) | 21.2% | 14.3% |
| Interquartile 75% (IQ3) | 51.6% | 22.9% |
| Interquartile Range (IQR) | 30.4% | 8.6% |
| Standard Deviation (Sample) | 20.1% | 12.5% |
| Standard Deviation (Population) | 20.0% | 12.4% |
Similar Demographics by Child Poverty Among Boys Under 16
Demographics Similar to Puerto Ricans by Child Poverty Among Boys Under 16
In terms of child poverty among boys under 16, the demographic groups most similar to Puerto Ricans are Lumbee (31.9%, a difference of 2.9%), Tohono O'odham (31.6%, a difference of 4.1%), Yuman (30.6%, a difference of 7.2%), Navajo (30.3%, a difference of 8.4%), and Pima (29.7%, a difference of 10.4%).
| Demographics | Rating | Rank | Child Poverty Among Boys Under 16 |
| Apache | 0.0 /100 | #333 | Tragic 24.5% |
| Blacks/African Americans | 0.0 /100 | #334 | Tragic 24.5% |
| Yup'ik | 0.0 /100 | #335 | Tragic 24.7% |
| Sioux | 0.0 /100 | #336 | Tragic 25.3% |
| Cheyenne | 0.0 /100 | #337 | Tragic 25.8% |
| Hopi | 0.0 /100 | #338 | Tragic 25.9% |
| Houma | 0.0 /100 | #339 | Tragic 26.2% |
| Crow | 0.0 /100 | #340 | Tragic 26.3% |
| Immigrants | Yemen | 0.0 /100 | #341 | Tragic 28.9% |
| Pima | 0.0 /100 | #342 | Tragic 29.7% |
| Navajo | 0.0 /100 | #343 | Tragic 30.3% |
| Yuman | 0.0 /100 | #344 | Tragic 30.6% |
| Tohono O'odham | 0.0 /100 | #345 | Tragic 31.6% |
| Lumbee | 0.0 /100 | #346 | Tragic 31.9% |
| Puerto Ricans | 0.0 /100 | #347 | Tragic 32.8% |
Demographics Similar to French by Child Poverty Among Boys Under 16
In terms of child poverty among boys under 16, the demographic groups most similar to French are Immigrants from Venezuela (15.8%, a difference of 0.14%), Puget Sound Salish (15.8%, a difference of 0.19%), Syrian (15.9%, a difference of 0.20%), Immigrants from Jordan (15.8%, a difference of 0.27%), and Slovak (15.8%, a difference of 0.28%).
| Demographics | Rating | Rank | Child Poverty Among Boys Under 16 |
| New Zealanders | 82.4 /100 | #146 | Excellent 15.7% |
| Venezuelans | 82.1 /100 | #147 | Excellent 15.7% |
| Brazilians | 81.0 /100 | #148 | Excellent 15.8% |
| Slovaks | 80.3 /100 | #149 | Excellent 15.8% |
| Immigrants | Jordan | 80.2 /100 | #150 | Excellent 15.8% |
| Puget Sound Salish | 79.8 /100 | #151 | Good 15.8% |
| Immigrants | Venezuela | 79.5 /100 | #152 | Good 15.8% |
| French | 78.7 /100 | #153 | Good 15.8% |
| Syrians | 77.5 /100 | #154 | Good 15.9% |
| French Canadians | 76.6 /100 | #155 | Good 15.9% |
| Israelis | 76.5 /100 | #156 | Good 15.9% |
| Immigrants | Nepal | 76.0 /100 | #157 | Good 15.9% |
| Yugoslavians | 75.9 /100 | #158 | Good 15.9% |
| Immigrants | Chile | 74.8 /100 | #159 | Good 15.9% |
| Immigrants | Northern Africa | 71.3 /100 | #160 | Good 16.0% |