Puerto Rican vs Immigrants from Haiti Child Poverty Among Boys Under 16
COMPARE
Puerto Rican
Immigrants from Haiti
Child Poverty Among Boys Under 16
Child Poverty Among Boys Under 16 Comparison
Puerto Ricans
Immigrants from Haiti
32.8%
CHILD POVERTY AMONG BOYS UNDER 16
0.0/ 100
METRIC RATING
347th/ 347
METRIC RANK
21.3%
CHILD POVERTY AMONG BOYS UNDER 16
0.0/ 100
METRIC RATING
303rd/ 347
METRIC RANK
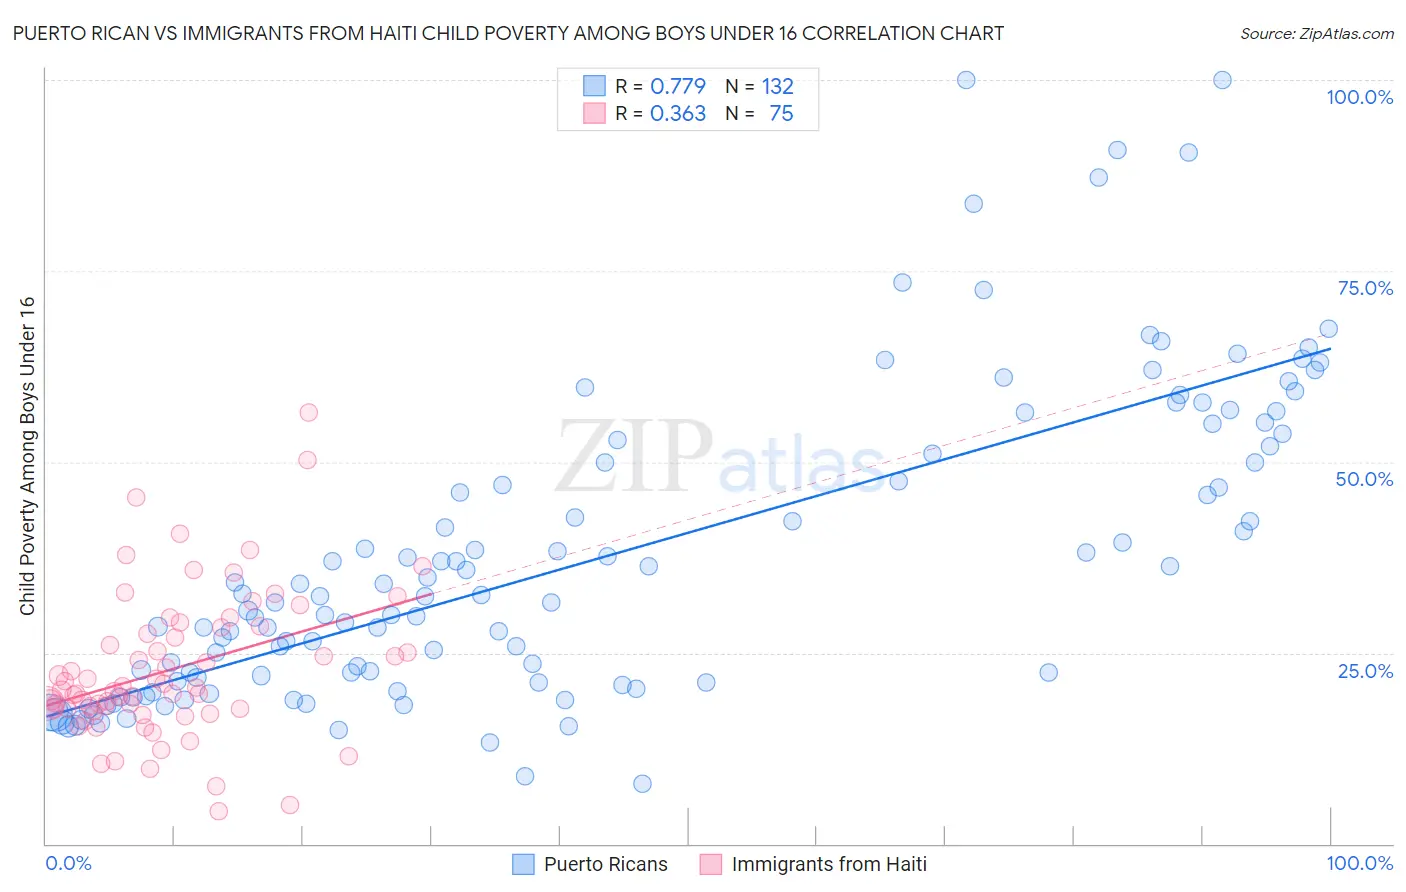
Puerto Rican vs Immigrants from Haiti Child Poverty Among Boys Under 16 Correlation Chart
The statistical analysis conducted on geographies consisting of 514,590,520 people shows a strong positive correlation between the proportion of Puerto Ricans and poverty level among boys under the age of 16 in the United States with a correlation coefficient (R) of 0.779 and weighted average of 32.8%. Similarly, the statistical analysis conducted on geographies consisting of 222,982,016 people shows a mild positive correlation between the proportion of Immigrants from Haiti and poverty level among boys under the age of 16 in the United States with a correlation coefficient (R) of 0.363 and weighted average of 21.3%, a difference of 54.5%.
Child Poverty Among Boys Under 16 Correlation Summary
| Measurement | Puerto Rican | Immigrants from Haiti |
| Minimum | 7.9% | 4.2% |
| Maximum | 100.0% | 56.4% |
| Range | 92.1% | 52.2% |
| Mean | 37.5% | 22.8% |
| Median | 32.4% | 20.2% |
| Interquartile 25% (IQ1) | 21.2% | 17.6% |
| Interquartile 75% (IQ3) | 51.6% | 28.3% |
| Interquartile Range (IQR) | 30.4% | 10.7% |
| Standard Deviation (Sample) | 20.1% | 9.6% |
| Standard Deviation (Population) | 20.0% | 9.6% |
Similar Demographics by Child Poverty Among Boys Under 16
Demographics Similar to Puerto Ricans by Child Poverty Among Boys Under 16
In terms of child poverty among boys under 16, the demographic groups most similar to Puerto Ricans are Lumbee (31.9%, a difference of 2.9%), Tohono O'odham (31.6%, a difference of 4.1%), Yuman (30.6%, a difference of 7.2%), Navajo (30.3%, a difference of 8.4%), and Pima (29.7%, a difference of 10.4%).
| Demographics | Rating | Rank | Child Poverty Among Boys Under 16 |
| Apache | 0.0 /100 | #333 | Tragic 24.5% |
| Blacks/African Americans | 0.0 /100 | #334 | Tragic 24.5% |
| Yup'ik | 0.0 /100 | #335 | Tragic 24.7% |
| Sioux | 0.0 /100 | #336 | Tragic 25.3% |
| Cheyenne | 0.0 /100 | #337 | Tragic 25.8% |
| Hopi | 0.0 /100 | #338 | Tragic 25.9% |
| Houma | 0.0 /100 | #339 | Tragic 26.2% |
| Crow | 0.0 /100 | #340 | Tragic 26.3% |
| Immigrants | Yemen | 0.0 /100 | #341 | Tragic 28.9% |
| Pima | 0.0 /100 | #342 | Tragic 29.7% |
| Navajo | 0.0 /100 | #343 | Tragic 30.3% |
| Yuman | 0.0 /100 | #344 | Tragic 30.6% |
| Tohono O'odham | 0.0 /100 | #345 | Tragic 31.6% |
| Lumbee | 0.0 /100 | #346 | Tragic 31.9% |
| Puerto Ricans | 0.0 /100 | #347 | Tragic 32.8% |
Demographics Similar to Immigrants from Haiti by Child Poverty Among Boys Under 16
In terms of child poverty among boys under 16, the demographic groups most similar to Immigrants from Haiti are Immigrants from Central America (21.3%, a difference of 0.060%), Kiowa (21.3%, a difference of 0.23%), Immigrants from Grenada (21.3%, a difference of 0.24%), Choctaw (21.3%, a difference of 0.33%), and Guatemalan (21.1%, a difference of 0.54%).
| Demographics | Rating | Rank | Child Poverty Among Boys Under 16 |
| Indonesians | 0.0 /100 | #296 | Tragic 20.8% |
| Hispanics or Latinos | 0.0 /100 | #297 | Tragic 20.9% |
| Chippewa | 0.0 /100 | #298 | Tragic 21.0% |
| Immigrants | Caribbean | 0.0 /100 | #299 | Tragic 21.0% |
| Haitians | 0.0 /100 | #300 | Tragic 21.0% |
| Guatemalans | 0.0 /100 | #301 | Tragic 21.1% |
| Somalis | 0.0 /100 | #302 | Tragic 21.1% |
| Immigrants | Haiti | 0.0 /100 | #303 | Tragic 21.3% |
| Immigrants | Central America | 0.0 /100 | #304 | Tragic 21.3% |
| Kiowa | 0.0 /100 | #305 | Tragic 21.3% |
| Immigrants | Grenada | 0.0 /100 | #306 | Tragic 21.3% |
| Choctaw | 0.0 /100 | #307 | Tragic 21.3% |
| Immigrants | Mexico | 0.0 /100 | #308 | Tragic 21.5% |
| Seminole | 0.0 /100 | #309 | Tragic 21.5% |
| Creek | 0.0 /100 | #310 | Tragic 21.5% |