Nicaraguan vs Mongolian Single Mother Poverty
COMPARE
Nicaraguan
Mongolian
Single Mother Poverty
Single Mother Poverty Comparison
Nicaraguans
Mongolians
29.8%
SINGLE MOTHER POVERTY
12.4/ 100
METRIC RATING
212th/ 347
METRIC RANK
27.7%
SINGLE MOTHER POVERTY
98.7/ 100
METRIC RATING
85th/ 347
METRIC RANK
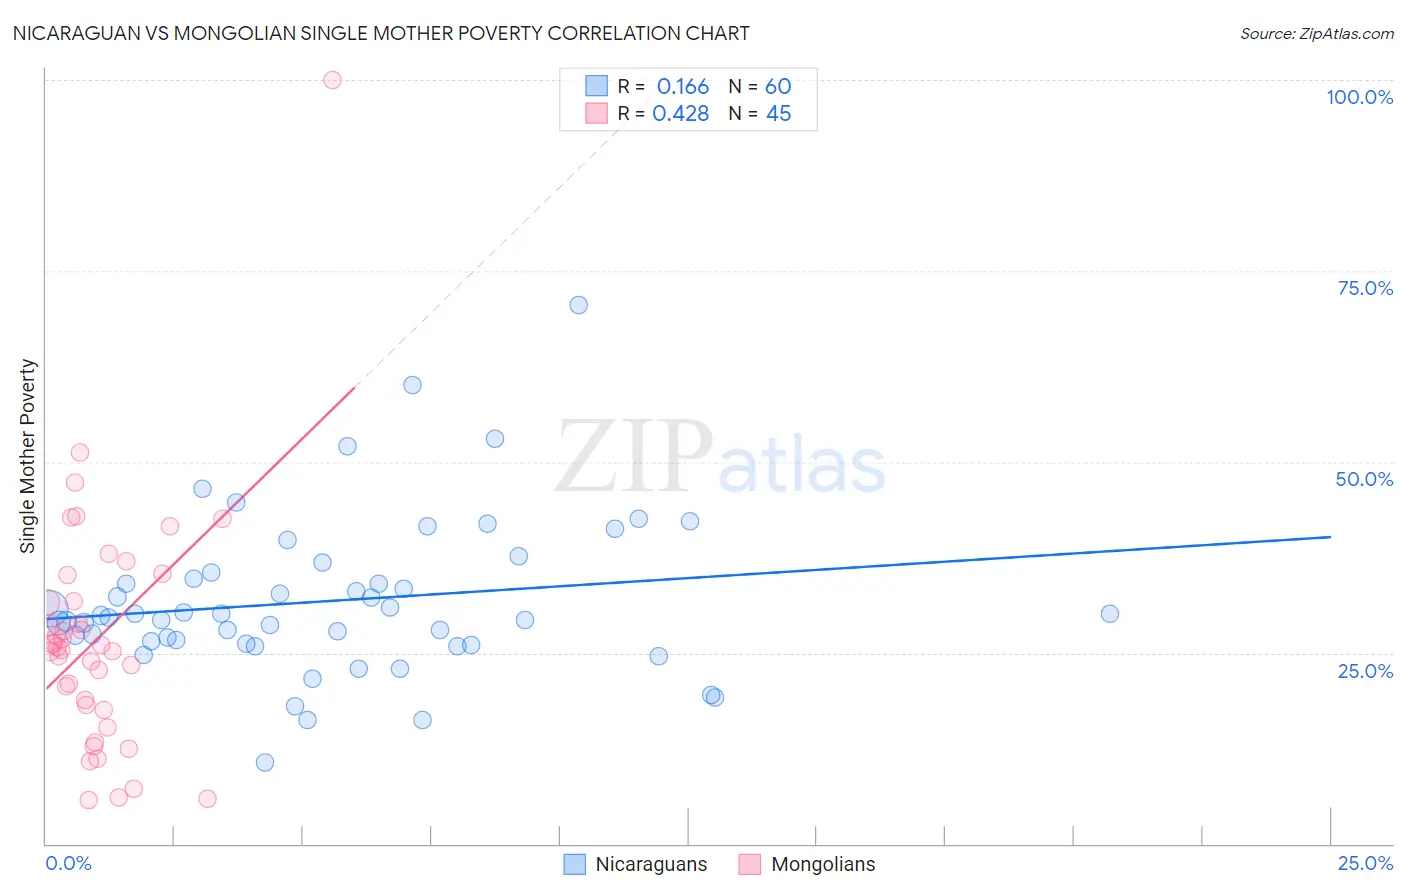
Nicaraguan vs Mongolian Single Mother Poverty Correlation Chart
The statistical analysis conducted on geographies consisting of 282,208,103 people shows a poor positive correlation between the proportion of Nicaraguans and poverty level among single mothers in the United States with a correlation coefficient (R) of 0.166 and weighted average of 29.8%. Similarly, the statistical analysis conducted on geographies consisting of 139,079,734 people shows a moderate positive correlation between the proportion of Mongolians and poverty level among single mothers in the United States with a correlation coefficient (R) of 0.428 and weighted average of 27.7%, a difference of 7.9%.
Single Mother Poverty Correlation Summary
| Measurement | Nicaraguan | Mongolian |
| Minimum | 10.6% | 5.8% |
| Maximum | 70.6% | 100.0% |
| Range | 60.0% | 94.2% |
| Mean | 31.8% | 27.0% |
| Median | 29.7% | 25.8% |
| Interquartile 25% (IQ1) | 26.3% | 17.8% |
| Interquartile 75% (IQ3) | 35.1% | 33.5% |
| Interquartile Range (IQR) | 8.8% | 15.6% |
| Standard Deviation (Sample) | 10.4% | 15.8% |
| Standard Deviation (Population) | 10.3% | 15.7% |
Similar Demographics by Single Mother Poverty
Demographics Similar to Nicaraguans by Single Mother Poverty
In terms of single mother poverty, the demographic groups most similar to Nicaraguans are Guyanese (29.8%, a difference of 0.040%), Immigrants from Thailand (29.9%, a difference of 0.050%), Liberian (29.9%, a difference of 0.080%), Jamaican (29.9%, a difference of 0.080%), and Haitian (29.8%, a difference of 0.090%).
| Demographics | Rating | Rank | Single Mother Poverty |
| Czechoslovakians | 16.1 /100 | #205 | Poor 29.7% |
| Immigrants | Haiti | 15.8 /100 | #206 | Poor 29.7% |
| Immigrants | Panama | 15.5 /100 | #207 | Poor 29.8% |
| Immigrants | Guyana | 14.7 /100 | #208 | Poor 29.8% |
| Irish | 13.9 /100 | #209 | Poor 29.8% |
| Haitians | 13.3 /100 | #210 | Poor 29.8% |
| Guyanese | 12.8 /100 | #211 | Poor 29.8% |
| Nicaraguans | 12.4 /100 | #212 | Poor 29.8% |
| Immigrants | Thailand | 12.0 /100 | #213 | Poor 29.9% |
| Liberians | 11.7 /100 | #214 | Poor 29.9% |
| Jamaicans | 11.7 /100 | #215 | Poor 29.9% |
| Immigrants | Western Africa | 11.5 /100 | #216 | Poor 29.9% |
| Immigrants | Ghana | 11.3 /100 | #217 | Poor 29.9% |
| Hungarians | 10.3 /100 | #218 | Poor 29.9% |
| Finns | 9.3 /100 | #219 | Tragic 30.0% |
Demographics Similar to Mongolians by Single Mother Poverty
In terms of single mother poverty, the demographic groups most similar to Mongolians are Immigrants from Latvia (27.7%, a difference of 0.0%), Greek (27.7%, a difference of 0.040%), Immigrants from Cameroon (27.6%, a difference of 0.090%), Immigrants from Ukraine (27.7%, a difference of 0.090%), and Afghan (27.7%, a difference of 0.19%).
| Demographics | Rating | Rank | Single Mother Poverty |
| Immigrants | North Macedonia | 99.2 /100 | #78 | Exceptional 27.5% |
| Immigrants | Italy | 99.1 /100 | #79 | Exceptional 27.5% |
| Taiwanese | 99.1 /100 | #80 | Exceptional 27.5% |
| Immigrants | Scotland | 98.9 /100 | #81 | Exceptional 27.6% |
| Immigrants | Cameroon | 98.8 /100 | #82 | Exceptional 27.6% |
| Greeks | 98.7 /100 | #83 | Exceptional 27.7% |
| Immigrants | Latvia | 98.7 /100 | #84 | Exceptional 27.7% |
| Mongolians | 98.7 /100 | #85 | Exceptional 27.7% |
| Immigrants | Ukraine | 98.6 /100 | #86 | Exceptional 27.7% |
| Afghans | 98.5 /100 | #87 | Exceptional 27.7% |
| Ethiopians | 98.4 /100 | #88 | Exceptional 27.7% |
| Immigrants | Ethiopia | 98.4 /100 | #89 | Exceptional 27.7% |
| Immigrants | France | 98.2 /100 | #90 | Exceptional 27.8% |
| Immigrants | Albania | 98.0 /100 | #91 | Exceptional 27.8% |
| Estonians | 97.9 /100 | #92 | Exceptional 27.8% |