Bulgarian vs Mongolian Single Mother Poverty
COMPARE
Bulgarian
Mongolian
Single Mother Poverty
Single Mother Poverty Comparison
Bulgarians
Mongolians
26.5%
SINGLE MOTHER POVERTY
99.9/ 100
METRIC RATING
33rd/ 347
METRIC RANK
27.7%
SINGLE MOTHER POVERTY
98.7/ 100
METRIC RATING
85th/ 347
METRIC RANK
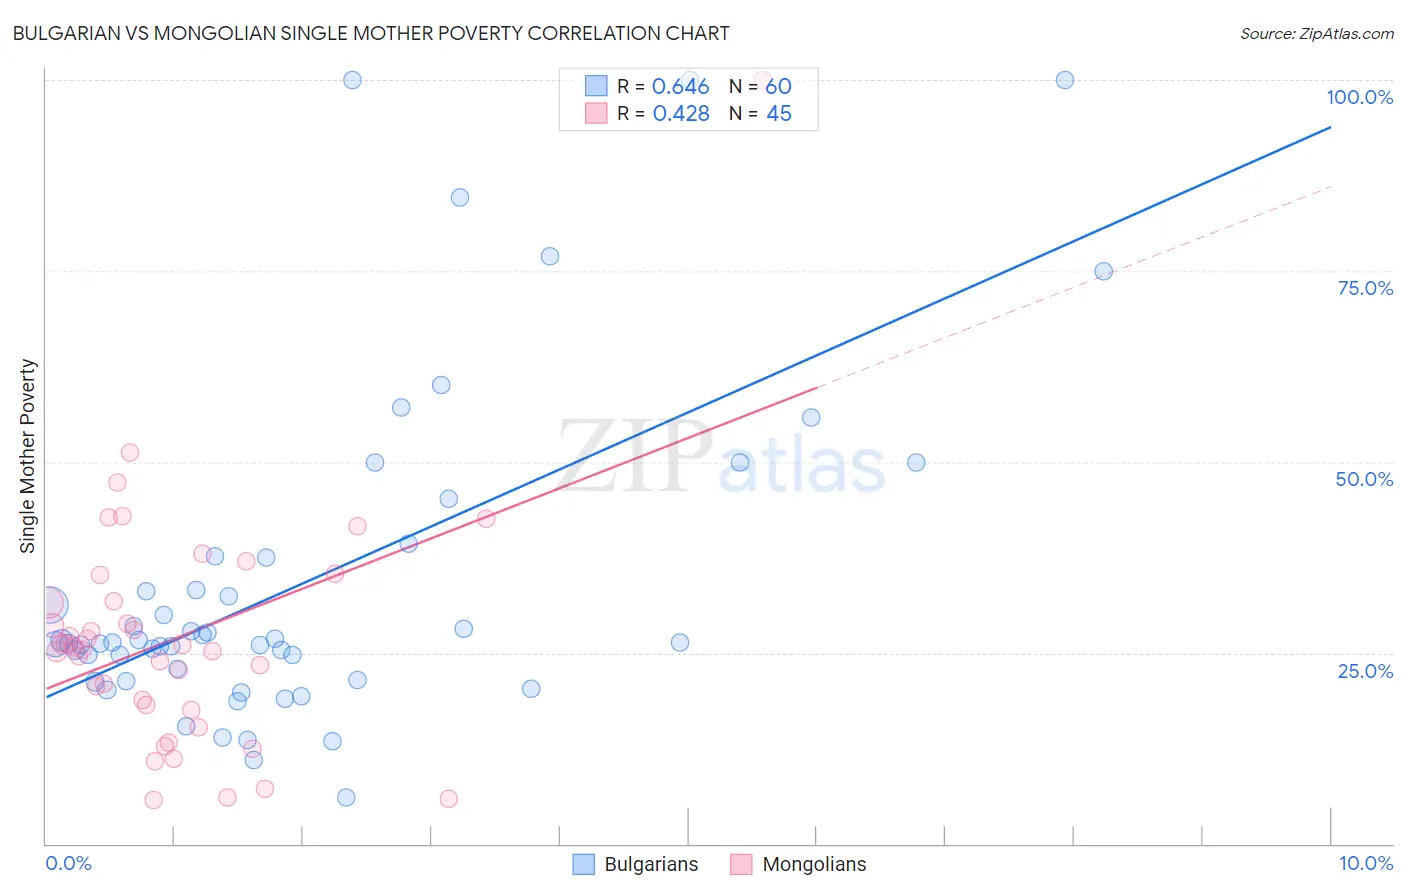
Bulgarian vs Mongolian Single Mother Poverty Correlation Chart
The statistical analysis conducted on geographies consisting of 202,203,367 people shows a significant positive correlation between the proportion of Bulgarians and poverty level among single mothers in the United States with a correlation coefficient (R) of 0.646 and weighted average of 26.5%. Similarly, the statistical analysis conducted on geographies consisting of 139,079,734 people shows a moderate positive correlation between the proportion of Mongolians and poverty level among single mothers in the United States with a correlation coefficient (R) of 0.428 and weighted average of 27.7%, a difference of 4.2%.
Single Mother Poverty Correlation Summary
| Measurement | Bulgarian | Mongolian |
| Minimum | 6.1% | 5.8% |
| Maximum | 100.0% | 100.0% |
| Range | 93.9% | 94.2% |
| Mean | 34.4% | 27.0% |
| Median | 26.4% | 25.8% |
| Interquartile 25% (IQ1) | 22.1% | 17.8% |
| Interquartile 75% (IQ3) | 37.5% | 33.5% |
| Interquartile Range (IQR) | 15.4% | 15.6% |
| Standard Deviation (Sample) | 21.8% | 15.8% |
| Standard Deviation (Population) | 21.6% | 15.7% |
Similar Demographics by Single Mother Poverty
Demographics Similar to Bulgarians by Single Mother Poverty
In terms of single mother poverty, the demographic groups most similar to Bulgarians are Immigrants from Indonesia (26.6%, a difference of 0.010%), Tongan (26.5%, a difference of 0.040%), Maltese (26.6%, a difference of 0.13%), Okinawan (26.6%, a difference of 0.18%), and Immigrants from Israel (26.6%, a difference of 0.18%).
| Demographics | Rating | Rank | Single Mother Poverty |
| Immigrants | Sri Lanka | 100.0 /100 | #26 | Exceptional 26.3% |
| Immigrants | Japan | 100.0 /100 | #27 | Exceptional 26.4% |
| Koreans | 100.0 /100 | #28 | Exceptional 26.4% |
| Jordanians | 100.0 /100 | #29 | Exceptional 26.4% |
| Turks | 100.0 /100 | #30 | Exceptional 26.4% |
| Immigrants | Philippines | 100.0 /100 | #31 | Exceptional 26.5% |
| Tongans | 99.9 /100 | #32 | Exceptional 26.5% |
| Bulgarians | 99.9 /100 | #33 | Exceptional 26.5% |
| Immigrants | Indonesia | 99.9 /100 | #34 | Exceptional 26.6% |
| Maltese | 99.9 /100 | #35 | Exceptional 26.6% |
| Okinawans | 99.9 /100 | #36 | Exceptional 26.6% |
| Immigrants | Israel | 99.9 /100 | #37 | Exceptional 26.6% |
| Immigrants | Fiji | 99.9 /100 | #38 | Exceptional 26.6% |
| Sri Lankans | 99.9 /100 | #39 | Exceptional 26.7% |
| Immigrants | Vietnam | 99.9 /100 | #40 | Exceptional 26.7% |
Demographics Similar to Mongolians by Single Mother Poverty
In terms of single mother poverty, the demographic groups most similar to Mongolians are Immigrants from Latvia (27.7%, a difference of 0.0%), Greek (27.7%, a difference of 0.040%), Immigrants from Cameroon (27.6%, a difference of 0.090%), Immigrants from Ukraine (27.7%, a difference of 0.090%), and Afghan (27.7%, a difference of 0.19%).
| Demographics | Rating | Rank | Single Mother Poverty |
| Immigrants | North Macedonia | 99.2 /100 | #78 | Exceptional 27.5% |
| Immigrants | Italy | 99.1 /100 | #79 | Exceptional 27.5% |
| Taiwanese | 99.1 /100 | #80 | Exceptional 27.5% |
| Immigrants | Scotland | 98.9 /100 | #81 | Exceptional 27.6% |
| Immigrants | Cameroon | 98.8 /100 | #82 | Exceptional 27.6% |
| Greeks | 98.7 /100 | #83 | Exceptional 27.7% |
| Immigrants | Latvia | 98.7 /100 | #84 | Exceptional 27.7% |
| Mongolians | 98.7 /100 | #85 | Exceptional 27.7% |
| Immigrants | Ukraine | 98.6 /100 | #86 | Exceptional 27.7% |
| Afghans | 98.5 /100 | #87 | Exceptional 27.7% |
| Ethiopians | 98.4 /100 | #88 | Exceptional 27.7% |
| Immigrants | Ethiopia | 98.4 /100 | #89 | Exceptional 27.7% |
| Immigrants | France | 98.2 /100 | #90 | Exceptional 27.8% |
| Immigrants | Albania | 98.0 /100 | #91 | Exceptional 27.8% |
| Estonians | 97.9 /100 | #92 | Exceptional 27.8% |