Potawatomi vs Bangladeshi Unemployment
COMPARE
Potawatomi
Bangladeshi
Unemployment
Unemployment Comparison
Potawatomi
Bangladeshis
5.2%
UNEMPLOYMENT
76.2/ 100
METRIC RATING
150th/ 347
METRIC RANK
5.4%
UNEMPLOYMENT
11.2/ 100
METRIC RATING
219th/ 347
METRIC RANK
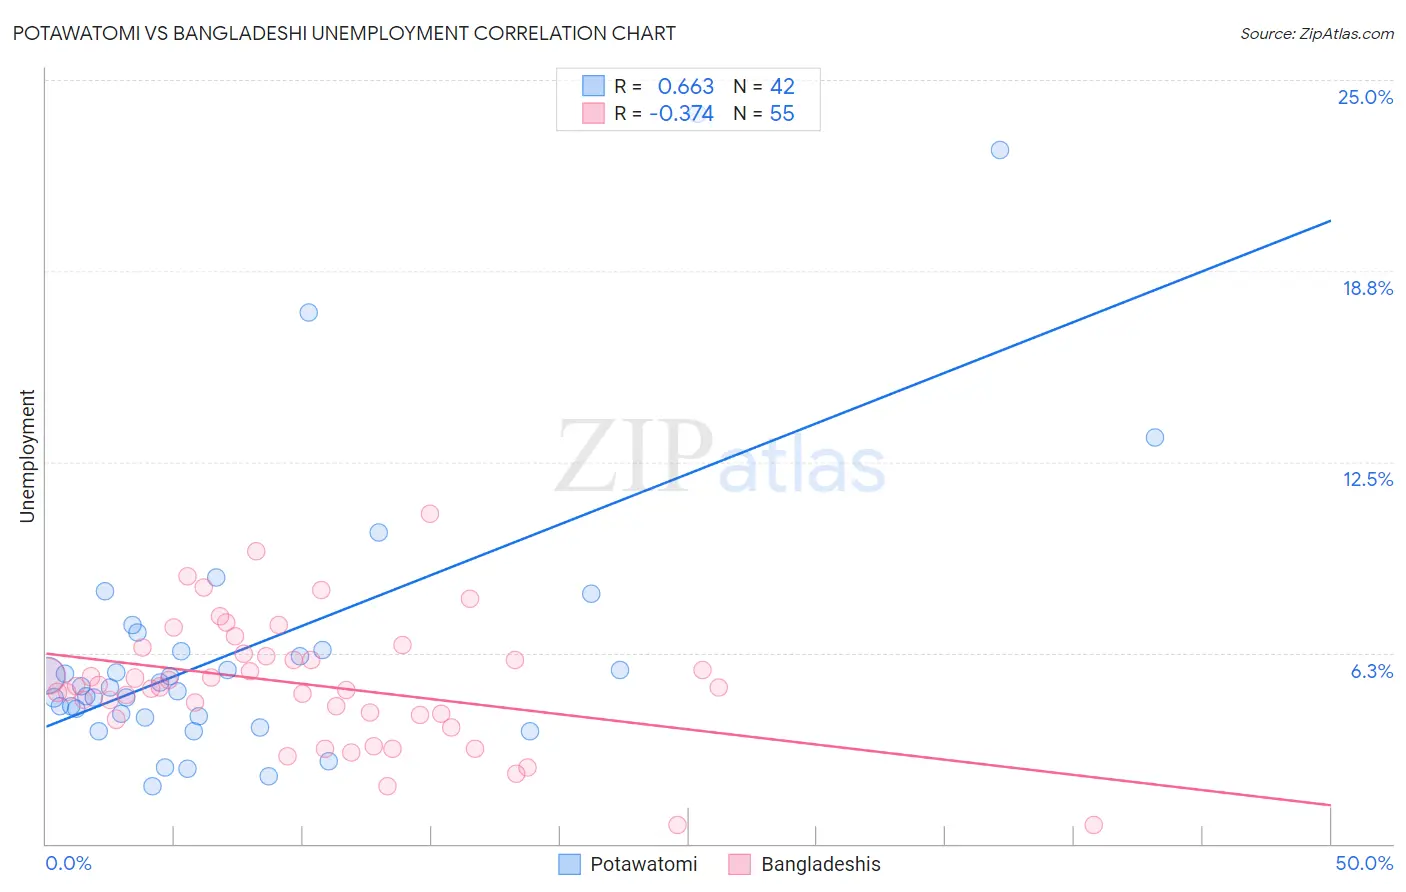
Potawatomi vs Bangladeshi Unemployment Correlation Chart
The statistical analysis conducted on geographies consisting of 117,685,766 people shows a significant positive correlation between the proportion of Potawatomi and unemployment in the United States with a correlation coefficient (R) of 0.663 and weighted average of 5.2%. Similarly, the statistical analysis conducted on geographies consisting of 141,326,736 people shows a mild negative correlation between the proportion of Bangladeshis and unemployment in the United States with a correlation coefficient (R) of -0.374 and weighted average of 5.4%, a difference of 5.1%.
Unemployment Correlation Summary
| Measurement | Potawatomi | Bangladeshi |
| Minimum | 1.9% | 0.60% |
| Maximum | 23.9% | 10.8% |
| Range | 22.0% | 10.2% |
| Mean | 6.5% | 5.2% |
| Median | 5.2% | 5.1% |
| Interquartile 25% (IQ1) | 4.2% | 4.2% |
| Interquartile 75% (IQ3) | 6.4% | 6.2% |
| Interquartile Range (IQR) | 2.2% | 2.0% |
| Standard Deviation (Sample) | 4.8% | 2.0% |
| Standard Deviation (Population) | 4.7% | 2.0% |
Similar Demographics by Unemployment
Demographics Similar to Potawatomi by Unemployment
In terms of unemployment, the demographic groups most similar to Potawatomi are Immigrants from Eastern Europe (5.2%, a difference of 0.070%), Immigrants from Hong Kong (5.2%, a difference of 0.080%), Egyptian (5.2%, a difference of 0.080%), Immigrants from China (5.2%, a difference of 0.12%), and Syrian (5.2%, a difference of 0.14%).
| Demographics | Rating | Rank | Unemployment |
| Immigrants | Chile | 82.8 /100 | #143 | Excellent 5.1% |
| Indonesians | 82.3 /100 | #144 | Excellent 5.1% |
| Immigrants | Norway | 81.8 /100 | #145 | Excellent 5.1% |
| Immigrants | Asia | 81.8 /100 | #146 | Excellent 5.1% |
| Indians (Asian) | 81.6 /100 | #147 | Excellent 5.1% |
| Immigrants | Italy | 79.1 /100 | #148 | Good 5.1% |
| Syrians | 77.7 /100 | #149 | Good 5.2% |
| Potawatomi | 76.2 /100 | #150 | Good 5.2% |
| Immigrants | Eastern Europe | 75.3 /100 | #151 | Good 5.2% |
| Immigrants | Hong Kong | 75.2 /100 | #152 | Good 5.2% |
| Egyptians | 75.2 /100 | #153 | Good 5.2% |
| Immigrants | China | 74.7 /100 | #154 | Good 5.2% |
| Immigrants | Northern Africa | 71.3 /100 | #155 | Good 5.2% |
| Immigrants | Kazakhstan | 70.4 /100 | #156 | Good 5.2% |
| Sri Lankans | 69.5 /100 | #157 | Good 5.2% |
Demographics Similar to Bangladeshis by Unemployment
In terms of unemployment, the demographic groups most similar to Bangladeshis are Soviet Union (5.4%, a difference of 0.080%), Immigrants from Philippines (5.4%, a difference of 0.12%), Iroquois (5.4%, a difference of 0.14%), Choctaw (5.4%, a difference of 0.22%), and Immigrants from South America (5.4%, a difference of 0.32%).
| Demographics | Rating | Rank | Unemployment |
| Ugandans | 18.0 /100 | #212 | Poor 5.4% |
| Immigrants | Middle Africa | 15.3 /100 | #213 | Poor 5.4% |
| Immigrants | Costa Rica | 15.2 /100 | #214 | Poor 5.4% |
| Delaware | 14.7 /100 | #215 | Poor 5.4% |
| Immigrants | South America | 13.5 /100 | #216 | Poor 5.4% |
| Immigrants | Albania | 13.5 /100 | #217 | Poor 5.4% |
| Choctaw | 12.7 /100 | #218 | Poor 5.4% |
| Bangladeshis | 11.2 /100 | #219 | Poor 5.4% |
| Soviet Union | 10.6 /100 | #220 | Poor 5.4% |
| Immigrants | Philippines | 10.4 /100 | #221 | Poor 5.4% |
| Iroquois | 10.3 /100 | #222 | Poor 5.4% |
| Seminole | 9.2 /100 | #223 | Tragic 5.4% |
| Israelis | 8.8 /100 | #224 | Tragic 5.4% |
| South American Indians | 7.8 /100 | #225 | Tragic 5.5% |
| Samoans | 7.1 /100 | #226 | Tragic 5.5% |