Immigrants from Greece vs Bangladeshi Single Male Poverty
COMPARE
Immigrants from Greece
Bangladeshi
Single Male Poverty
Single Male Poverty Comparison
Immigrants from Greece
Bangladeshis
11.9%
SINGLE MALE POVERTY
99.6/ 100
METRIC RATING
71st/ 347
METRIC RANK
13.3%
SINGLE MALE POVERTY
3.7/ 100
METRIC RATING
235th/ 347
METRIC RANK
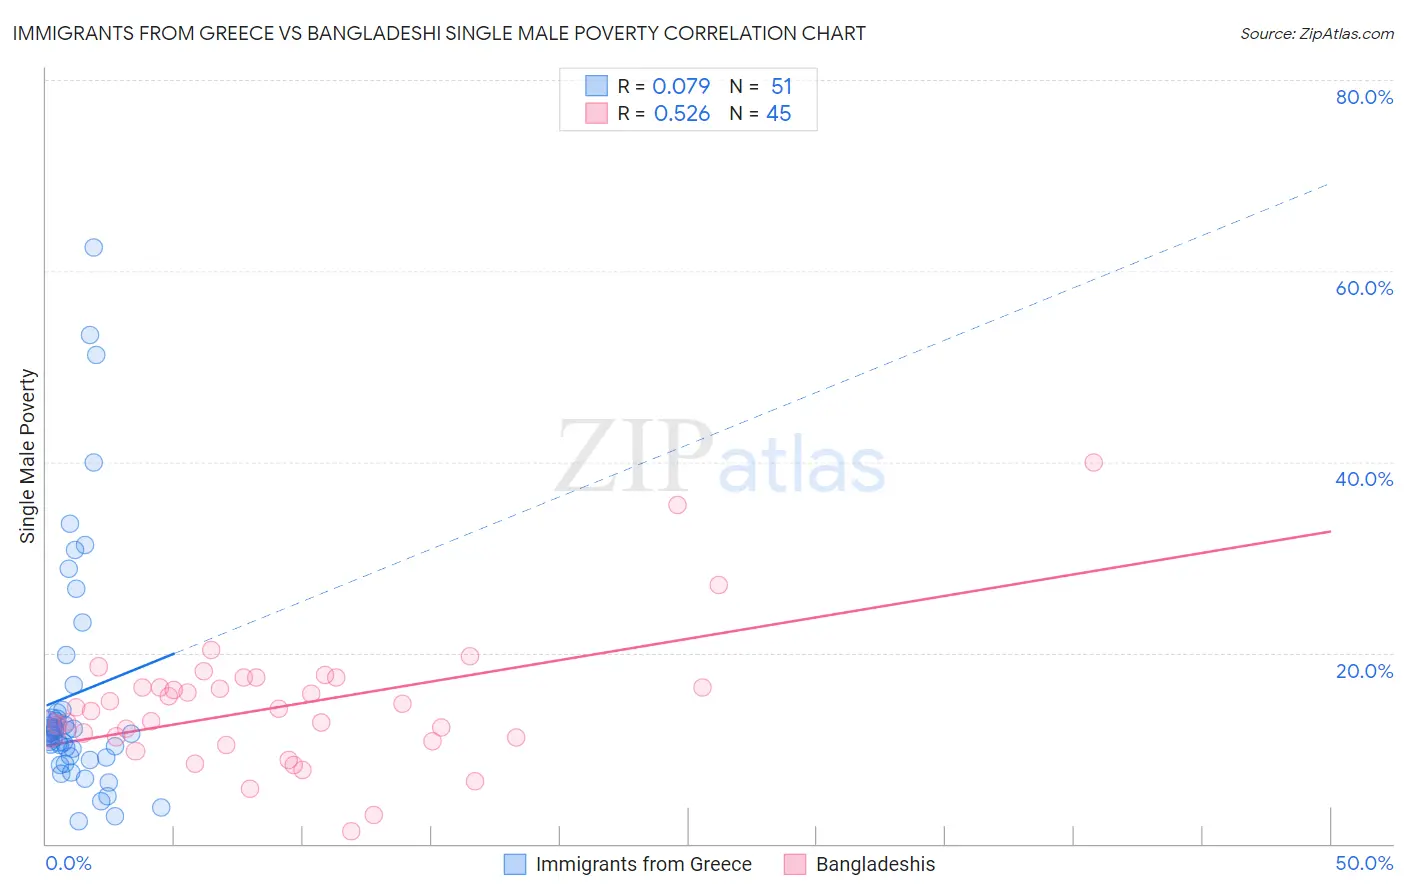
Immigrants from Greece vs Bangladeshi Single Male Poverty Correlation Chart
The statistical analysis conducted on geographies consisting of 196,065,310 people shows a slight positive correlation between the proportion of Immigrants from Greece and poverty level among single males in the United States with a correlation coefficient (R) of 0.079 and weighted average of 11.9%. Similarly, the statistical analysis conducted on geographies consisting of 134,113,248 people shows a substantial positive correlation between the proportion of Bangladeshis and poverty level among single males in the United States with a correlation coefficient (R) of 0.526 and weighted average of 13.3%, a difference of 12.4%.
Single Male Poverty Correlation Summary
| Measurement | Immigrants from Greece | Bangladeshi |
| Minimum | 2.4% | 1.3% |
| Maximum | 62.5% | 40.0% |
| Range | 60.1% | 38.7% |
| Mean | 15.7% | 14.5% |
| Median | 11.7% | 14.1% |
| Interquartile 25% (IQ1) | 9.1% | 10.9% |
| Interquartile 75% (IQ3) | 14.0% | 16.9% |
| Interquartile Range (IQR) | 4.9% | 5.9% |
| Standard Deviation (Sample) | 12.9% | 6.9% |
| Standard Deviation (Population) | 12.8% | 6.8% |
Similar Demographics by Single Male Poverty
Demographics Similar to Immigrants from Greece by Single Male Poverty
In terms of single male poverty, the demographic groups most similar to Immigrants from Greece are Immigrants from Nepal (11.9%, a difference of 0.060%), Immigrants from Russia (11.9%, a difference of 0.080%), Immigrants from Croatia (11.9%, a difference of 0.10%), Immigrants from Ukraine (11.9%, a difference of 0.12%), and Immigrants from Uruguay (11.9%, a difference of 0.13%).
| Demographics | Rating | Rank | Single Male Poverty |
| Immigrants | Eastern Europe | 99.6 /100 | #64 | Exceptional 11.8% |
| Laotians | 99.6 /100 | #65 | Exceptional 11.9% |
| Immigrants | Uruguay | 99.6 /100 | #66 | Exceptional 11.9% |
| Immigrants | Ukraine | 99.6 /100 | #67 | Exceptional 11.9% |
| Immigrants | Croatia | 99.6 /100 | #68 | Exceptional 11.9% |
| Immigrants | Russia | 99.6 /100 | #69 | Exceptional 11.9% |
| Immigrants | Nepal | 99.6 /100 | #70 | Exceptional 11.9% |
| Immigrants | Greece | 99.6 /100 | #71 | Exceptional 11.9% |
| Immigrants | Argentina | 99.5 /100 | #72 | Exceptional 11.9% |
| Argentineans | 99.5 /100 | #73 | Exceptional 11.9% |
| Chileans | 99.5 /100 | #74 | Exceptional 11.9% |
| Uruguayans | 99.4 /100 | #75 | Exceptional 11.9% |
| Immigrants | Northern Africa | 99.4 /100 | #76 | Exceptional 11.9% |
| Immigrants | Malaysia | 99.2 /100 | #77 | Exceptional 12.0% |
| Immigrants | Venezuela | 99.1 /100 | #78 | Exceptional 12.0% |
Demographics Similar to Bangladeshis by Single Male Poverty
In terms of single male poverty, the demographic groups most similar to Bangladeshis are Luxembourger (13.4%, a difference of 0.050%), British (13.3%, a difference of 0.10%), Canadian (13.3%, a difference of 0.10%), British West Indian (13.4%, a difference of 0.11%), and Immigrants from Ghana (13.4%, a difference of 0.21%).
| Demographics | Rating | Rank | Single Male Poverty |
| Lebanese | 6.6 /100 | #228 | Tragic 13.2% |
| Europeans | 6.2 /100 | #229 | Tragic 13.3% |
| Ghanaians | 6.1 /100 | #230 | Tragic 13.3% |
| Slavs | 5.3 /100 | #231 | Tragic 13.3% |
| Immigrants | Caribbean | 5.0 /100 | #232 | Tragic 13.3% |
| British | 4.0 /100 | #233 | Tragic 13.3% |
| Canadians | 4.0 /100 | #234 | Tragic 13.3% |
| Bangladeshis | 3.7 /100 | #235 | Tragic 13.3% |
| Luxembourgers | 3.6 /100 | #236 | Tragic 13.4% |
| British West Indians | 3.4 /100 | #237 | Tragic 13.4% |
| Immigrants | Ghana | 3.2 /100 | #238 | Tragic 13.4% |
| Czechoslovakians | 3.0 /100 | #239 | Tragic 13.4% |
| Belizeans | 2.3 /100 | #240 | Tragic 13.4% |
| Immigrants | Germany | 2.1 /100 | #241 | Tragic 13.4% |
| Carpatho Rusyns | 2.1 /100 | #242 | Tragic 13.4% |