Portuguese vs Romanian Child Poverty Among Girls Under 16
COMPARE
Portuguese
Romanian
Child Poverty Among Girls Under 16
Child Poverty Among Girls Under 16 Comparison
Portuguese
Romanians
15.3%
CHILD POVERTY AMONG GIRLS UNDER 16
91.8/ 100
METRIC RATING
122nd/ 347
METRIC RANK
15.0%
CHILD POVERTY AMONG GIRLS UNDER 16
95.3/ 100
METRIC RATING
104th/ 347
METRIC RANK
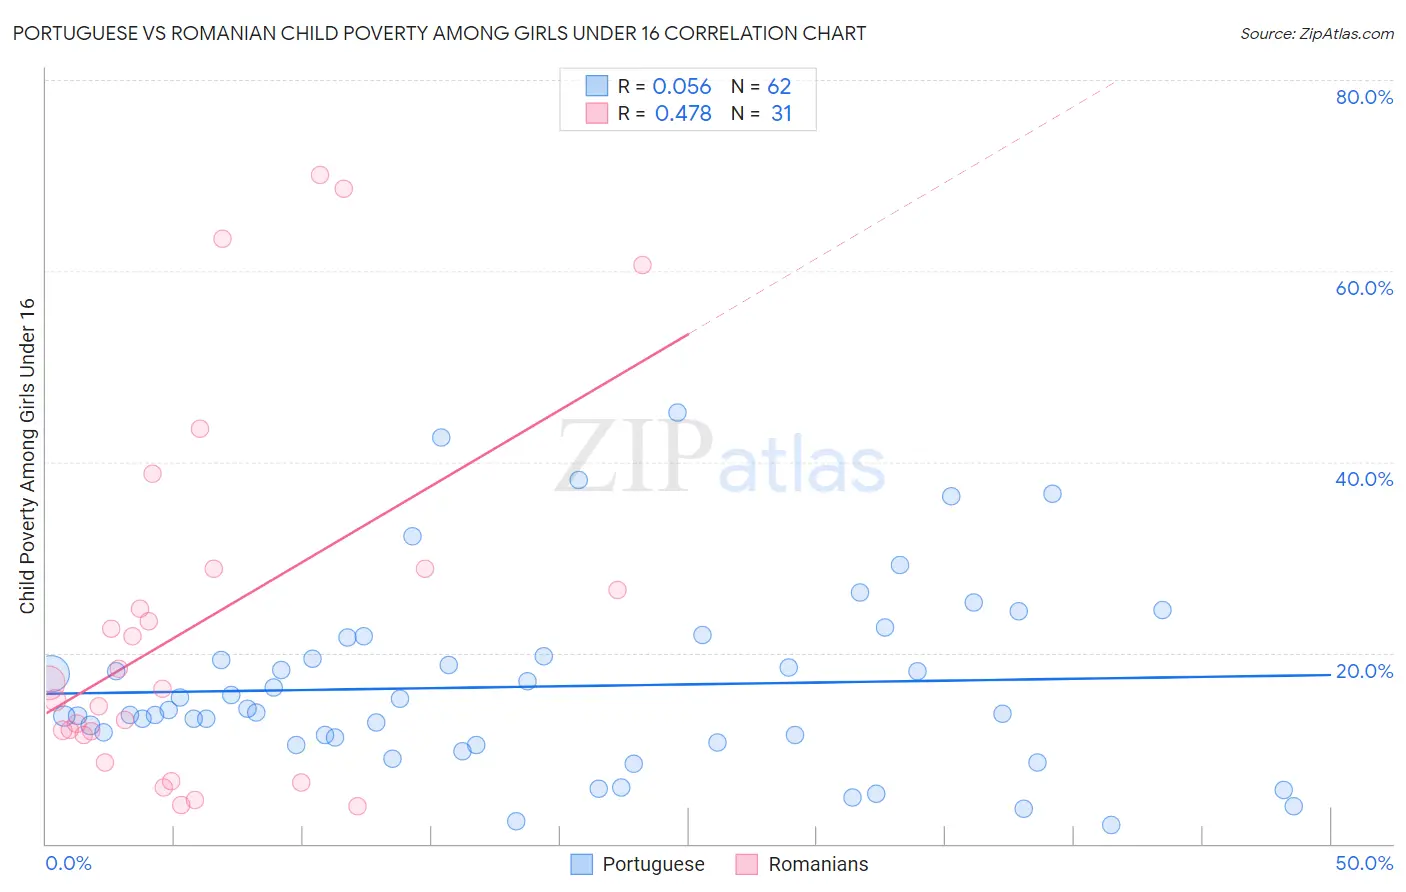
Portuguese vs Romanian Child Poverty Among Girls Under 16 Correlation Chart
The statistical analysis conducted on geographies consisting of 438,899,993 people shows a slight positive correlation between the proportion of Portuguese and poverty level among girls under the age of 16 in the United States with a correlation coefficient (R) of 0.056 and weighted average of 15.3%. Similarly, the statistical analysis conducted on geographies consisting of 369,938,935 people shows a moderate positive correlation between the proportion of Romanians and poverty level among girls under the age of 16 in the United States with a correlation coefficient (R) of 0.478 and weighted average of 15.0%, a difference of 1.9%.
Child Poverty Among Girls Under 16 Correlation Summary
| Measurement | Portuguese | Romanian |
| Minimum | 2.0% | 4.0% |
| Maximum | 45.2% | 70.0% |
| Range | 43.2% | 66.0% |
| Mean | 16.5% | 23.0% |
| Median | 13.9% | 16.3% |
| Interquartile 25% (IQ1) | 10.6% | 11.4% |
| Interquartile 75% (IQ3) | 19.7% | 28.8% |
| Interquartile Range (IQR) | 9.1% | 17.5% |
| Standard Deviation (Sample) | 9.6% | 19.3% |
| Standard Deviation (Population) | 9.5% | 19.0% |
Demographics Similar to Portuguese and Romanians by Child Poverty Among Girls Under 16
In terms of child poverty among girls under 16, the demographic groups most similar to Portuguese are Irish (15.3%, a difference of 0.090%), English (15.3%, a difference of 0.19%), Pakistani (15.3%, a difference of 0.21%), Immigrants from Zimbabwe (15.3%, a difference of 0.30%), and Immigrants from Southern Europe (15.3%, a difference of 0.41%). Similarly, the demographic groups most similar to Romanians are Immigrants from England (15.1%, a difference of 0.14%), Chilean (15.1%, a difference of 0.15%), British (15.0%, a difference of 0.16%), Immigrants from Ukraine (15.1%, a difference of 0.22%), and Immigrants from Brazil (15.1%, a difference of 0.29%).
| Demographics | Rating | Rank | Child Poverty Among Girls Under 16 |
| British | 95.6 /100 | #103 | Exceptional 15.0% |
| Romanians | 95.3 /100 | #104 | Exceptional 15.0% |
| Immigrants | England | 95.1 /100 | #105 | Exceptional 15.1% |
| Chileans | 95.1 /100 | #106 | Exceptional 15.1% |
| Immigrants | Ukraine | 95.0 /100 | #107 | Exceptional 15.1% |
| Immigrants | Brazil | 94.9 /100 | #108 | Exceptional 15.1% |
| Serbians | 94.8 /100 | #109 | Exceptional 15.1% |
| Immigrants | Croatia | 94.6 /100 | #110 | Exceptional 15.1% |
| Palestinians | 94.5 /100 | #111 | Exceptional 15.1% |
| Immigrants | Kazakhstan | 94.3 /100 | #112 | Exceptional 15.1% |
| Dutch | 94.3 /100 | #113 | Exceptional 15.1% |
| Sri Lankans | 94.0 /100 | #114 | Exceptional 15.2% |
| Belgians | 93.9 /100 | #115 | Exceptional 15.2% |
| Immigrants | Denmark | 93.3 /100 | #116 | Exceptional 15.2% |
| Immigrants | North Macedonia | 93.1 /100 | #117 | Exceptional 15.2% |
| Immigrants | Southern Europe | 92.7 /100 | #118 | Exceptional 15.3% |
| Immigrants | Zimbabwe | 92.5 /100 | #119 | Exceptional 15.3% |
| Pakistanis | 92.3 /100 | #120 | Exceptional 15.3% |
| English | 92.2 /100 | #121 | Exceptional 15.3% |
| Portuguese | 91.8 /100 | #122 | Exceptional 15.3% |
| Irish | 91.5 /100 | #123 | Exceptional 15.3% |