Portuguese vs Native Hawaiian Child Poverty Among Girls Under 16
COMPARE
Portuguese
Native Hawaiian
Child Poverty Among Girls Under 16
Child Poverty Among Girls Under 16 Comparison
Portuguese
Native Hawaiians
15.3%
CHILD POVERTY AMONG GIRLS UNDER 16
91.8/ 100
METRIC RATING
122nd/ 347
METRIC RANK
15.5%
CHILD POVERTY AMONG GIRLS UNDER 16
89.0/ 100
METRIC RATING
136th/ 347
METRIC RANK
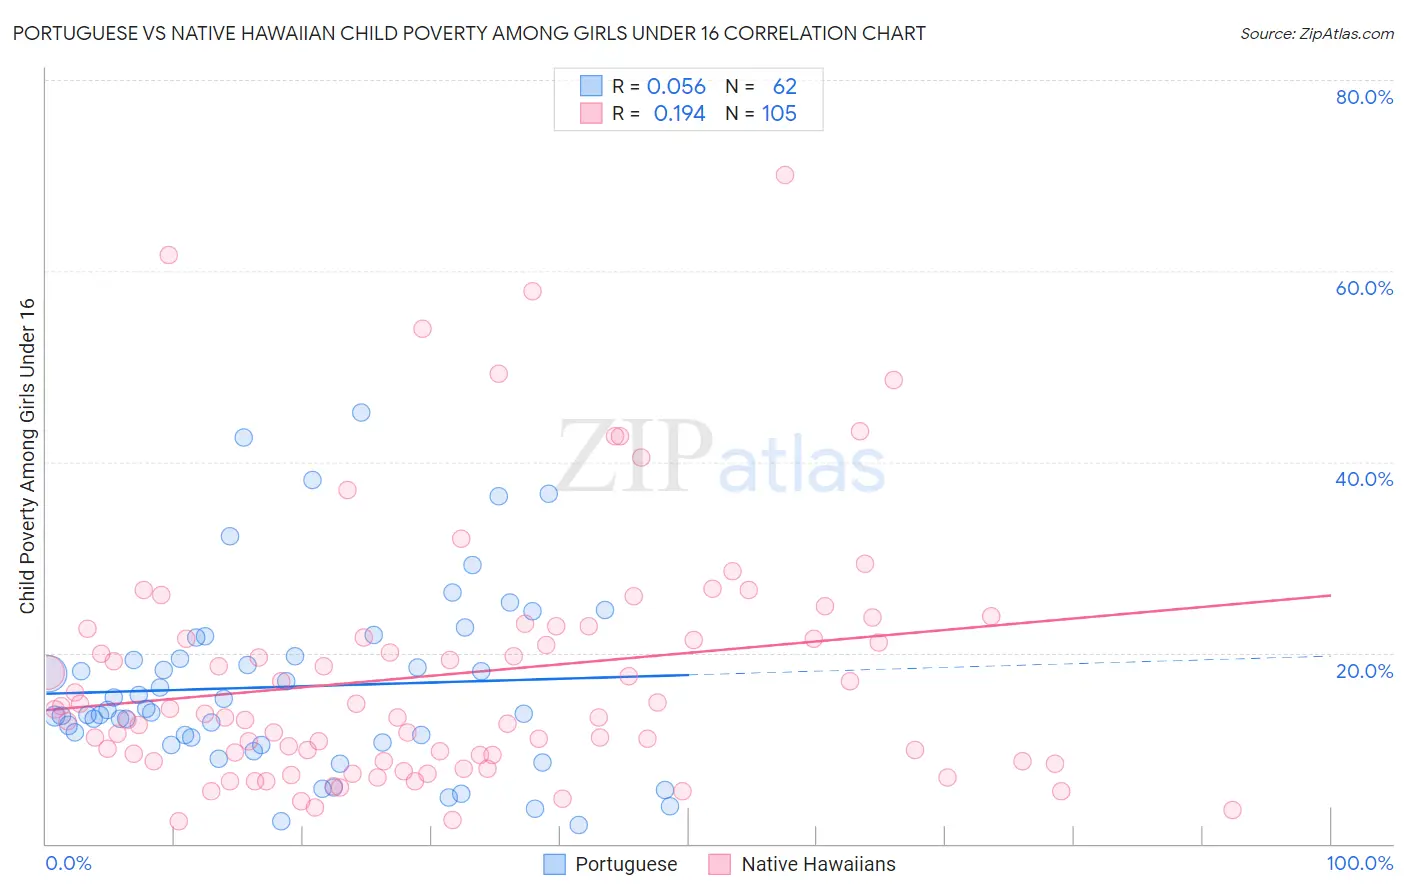
Portuguese vs Native Hawaiian Child Poverty Among Girls Under 16 Correlation Chart
The statistical analysis conducted on geographies consisting of 438,899,993 people shows a slight positive correlation between the proportion of Portuguese and poverty level among girls under the age of 16 in the United States with a correlation coefficient (R) of 0.056 and weighted average of 15.3%. Similarly, the statistical analysis conducted on geographies consisting of 328,090,370 people shows a poor positive correlation between the proportion of Native Hawaiians and poverty level among girls under the age of 16 in the United States with a correlation coefficient (R) of 0.194 and weighted average of 15.5%, a difference of 1.0%.
Child Poverty Among Girls Under 16 Correlation Summary
| Measurement | Portuguese | Native Hawaiian |
| Minimum | 2.0% | 2.4% |
| Maximum | 45.2% | 70.0% |
| Range | 43.2% | 67.6% |
| Mean | 16.5% | 17.7% |
| Median | 13.9% | 13.3% |
| Interquartile 25% (IQ1) | 10.6% | 8.7% |
| Interquartile 75% (IQ3) | 19.7% | 22.1% |
| Interquartile Range (IQR) | 9.1% | 13.4% |
| Standard Deviation (Sample) | 9.6% | 13.3% |
| Standard Deviation (Population) | 9.5% | 13.2% |
Demographics Similar to Portuguese and Native Hawaiians by Child Poverty Among Girls Under 16
In terms of child poverty among girls under 16, the demographic groups most similar to Portuguese are Irish (15.3%, a difference of 0.090%), Carpatho Rusyn (15.3%, a difference of 0.14%), English (15.3%, a difference of 0.19%), Pakistani (15.3%, a difference of 0.21%), and Peruvian (15.4%, a difference of 0.25%). Similarly, the demographic groups most similar to Native Hawaiians are Czechoslovakian (15.5%, a difference of 0.020%), Immigrants from Spain (15.5%, a difference of 0.050%), South African (15.5%, a difference of 0.090%), Brazilian (15.4%, a difference of 0.21%), and Immigrants from Vietnam (15.5%, a difference of 0.22%).
| Demographics | Rating | Rank | Child Poverty Among Girls Under 16 |
| Immigrants | Zimbabwe | 92.5 /100 | #119 | Exceptional 15.3% |
| Pakistanis | 92.3 /100 | #120 | Exceptional 15.3% |
| English | 92.2 /100 | #121 | Exceptional 15.3% |
| Portuguese | 91.8 /100 | #122 | Exceptional 15.3% |
| Irish | 91.5 /100 | #123 | Exceptional 15.3% |
| Carpatho Rusyns | 91.4 /100 | #124 | Exceptional 15.3% |
| Peruvians | 91.2 /100 | #125 | Exceptional 15.4% |
| Scottish | 91.0 /100 | #126 | Exceptional 15.4% |
| Immigrants | Norway | 90.8 /100 | #127 | Exceptional 15.4% |
| Albanians | 90.5 /100 | #128 | Exceptional 15.4% |
| Immigrants | South Eastern Asia | 90.5 /100 | #129 | Exceptional 15.4% |
| Puget Sound Salish | 90.1 /100 | #130 | Exceptional 15.4% |
| Immigrants | Western Europe | 90.0 /100 | #131 | Exceptional 15.4% |
| Mongolians | 89.7 /100 | #132 | Excellent 15.4% |
| Brazilians | 89.6 /100 | #133 | Excellent 15.4% |
| Immigrants | Spain | 89.1 /100 | #134 | Excellent 15.5% |
| Czechoslovakians | 89.0 /100 | #135 | Excellent 15.5% |
| Native Hawaiians | 89.0 /100 | #136 | Excellent 15.5% |
| South Africans | 88.7 /100 | #137 | Excellent 15.5% |
| Immigrants | Vietnam | 88.2 /100 | #138 | Excellent 15.5% |
| Armenians | 87.9 /100 | #139 | Excellent 15.5% |