Portuguese vs Immigrants from Hungary Single Female Poverty

COMPARE

Portuguese
Race
Ancestry
AfghanAfricanAlaska NativeAlaskan AthabascanAlbanianAleutAlsatianAmericanApacheArabArapahoArgentineanArmenianAssyrian/Chaldean/SyriacAustralianAustrianBahamianBangladeshiBarbadianBasqueBelgianBelizeanBermudanBhutaneseBlackfeetBolivianBrazilianBritishBritish West IndianBulgarianBurmeseCajunCambodianCanadianCape VerdeanCarpatho RusynCelticCentral AmericanCentral American IndianCherokeeCheyenneChickasawChileanChineseChippewaChoctawColombianColvilleComancheCosta RicanCreeCreekCroatianCrowCubanCypriotCzechCzechoslovakianDanishDelawareDominicanDutchDutch West IndianEastern EuropeanEcuadorianEgyptianEnglishEstonianEthiopianEuropeanFijianFilipinoFinnishFrenchFrench American IndianFrench CanadianGermanGerman RussianGhanaianGreekGuamanian/ChamorroGuatemalanGuyaneseHaitianHmongHonduranHopiHoumaHungarianIcelanderIndian (Asian)IndonesianInupiatIranianIraqiIrishIroquoisIsraeliItalianJamaicanJapaneseJordanianKenyanKiowaKoreanLaotianLatvianLebaneseLiberianLithuanianLumbeeLuxembourgerMacedonianMalaysianMalteseMarshalleseMenomineeMexicanMexican American IndianMongolianMoroccanNative HawaiianNavajoNepaleseNew ZealanderNicaraguanNigerianNorthern EuropeanNorwegianOkinawanOsageOttawaPaiutePakistaniPalestinianPanamanianParaguayanPennsylvania GermanPeruvianPimaPolishPortuguesePotawatomiPuebloPuerto RicanPuget Sound SalishRomanianRussianSalvadoranSamoanScandinavianScotch-IrishScottishSeminoleSenegaleseSerbianShoshoneSierra LeoneanSiouxSlavicSlovakSloveneSomaliSouth AfricanSouth AmericanSouth American IndianSoviet UnionSpaniardSpanishSpanish AmericanSpanish American IndianSri LankanSubsaharan AfricanSudaneseSwedishSwissSyrianTaiwaneseThaiTlingit-HaidaTohono O'OdhamTonganTrinidadian and TobagonianTsimshianTurkishU.S. Virgin IslanderUgandanUkrainianUruguayanUteVenezuelanVietnameseWelshWest IndianYakamaYaquiYugoslavianYumanYup'ikZimbabwean
Immigration
NonimmigrantsImmigrantsAfghanistanAfricaAlbaniaArgentinaArmeniaAsiaAustraliaAustriaBahamasBangladeshBarbadosBelarusBelgiumBelizeBoliviaBosnia and HerzegovinaBrazilBulgariaBurma/MyanmarCabo VerdeCambodiaCameroonCanadaCaribbeanCentral AmericaChileChinaColombiaCongoCosta RicaCroatiaCubaCzechoslovakiaDenmarkDominicaDominican RepublicEastern AfricaEastern AsiaEastern EuropeEcuadorEgyptEl SalvadorEnglandEritreaEthiopiaEuropeFijiFranceGermanyGhanaGreeceGrenadaGuatemalaGuyanaHaitiHondurasHong KongIndiaIndonesiaIranIraqIrelandIsraelItalyJamaicaJapanJordanKazakhstanKenyaKoreaKuwaitLaosLatin AmericaLatviaLebanonLiberiaLithuaniaMalaysiaMexicoMicronesiaMiddle AfricaMoldovaMoroccoNepalNetherlandsNicaraguaNigeriaNorth AmericaNorth MacedoniaNorthern AfricaNorthern EuropeNorwayOceaniaPakistanPanamaPeruPhilippinesPolandPortugalRomaniaRussiaSaudi ArabiaScotlandSenegalSerbiaSierra LeoneSingaporeSomaliaSouth AfricaSouth AmericaSouth Central AsiaSouth Eastern AsiaSouthern EuropeSpainSri LankaSt. Vincent and the GrenadinesSudanSwedenSwitzerlandSyriaTaiwanThailandTrinidad and TobagoTurkeyUgandaUkraineUruguayUzbekistanVenezuelaVietnamWest IndiesWestern AfricaWestern AsiaWestern EuropeYemenZaireZimbabweAzores
Immigrants from Hungary
Race
Ancestry
AfghanAfricanAlaska NativeAlaskan AthabascanAlbanianAleutAlsatianAmericanApacheArabArapahoArgentineanArmenianAssyrian/Chaldean/SyriacAustralianAustrianBahamianBangladeshiBarbadianBasqueBelgianBelizeanBermudanBhutaneseBlackfeetBolivianBrazilianBritishBritish West IndianBulgarianBurmeseCajunCambodianCanadianCape VerdeanCarpatho RusynCelticCentral AmericanCentral American IndianCherokeeCheyenneChickasawChileanChineseChippewaChoctawColombianColvilleComancheCosta RicanCreeCreekCroatianCrowCubanCypriotCzechCzechoslovakianDanishDelawareDominicanDutchDutch West IndianEastern EuropeanEcuadorianEgyptianEnglishEstonianEthiopianEuropeanFijianFilipinoFinnishFrenchFrench American IndianFrench CanadianGermanGerman RussianGhanaianGreekGuamanian/ChamorroGuatemalanGuyaneseHaitianHmongHonduranHopiHoumaHungarianIcelanderIndian (Asian)IndonesianInupiatIranianIraqiIrishIroquoisIsraeliItalianJamaicanJapaneseJordanianKenyanKiowaKoreanLaotianLatvianLebaneseLiberianLithuanianLumbeeLuxembourgerMacedonianMalaysianMalteseMarshalleseMenomineeMexicanMexican American IndianMongolianMoroccanNative HawaiianNavajoNepaleseNew ZealanderNicaraguanNigerianNorthern EuropeanNorwegianOkinawanOsageOttawaPaiutePakistaniPalestinianPanamanianParaguayanPennsylvania GermanPeruvianPimaPolishPotawatomiPuebloPuerto RicanPuget Sound SalishRomanianRussianSalvadoranSamoanScandinavianScotch-IrishScottishSeminoleSenegaleseSerbianShoshoneSierra LeoneanSiouxSlavicSlovakSloveneSomaliSouth AfricanSouth AmericanSouth American IndianSoviet UnionSpaniardSpanishSpanish AmericanSpanish American IndianSri LankanSubsaharan AfricanSudaneseSwedishSwissSyrianTaiwaneseThaiTlingit-HaidaTohono O'OdhamTonganTrinidadian and TobagonianTsimshianTurkishU.S. Virgin IslanderUgandanUkrainianUruguayanUteVenezuelanVietnameseWelshWest IndianYakamaYaquiYugoslavianYumanYup'ikZimbabwean
Immigration
NonimmigrantsImmigrantsAfghanistanAfricaAlbaniaArgentinaArmeniaAsiaAustraliaAustriaBahamasBangladeshBarbadosBelarusBelgiumBelizeBoliviaBosnia and HerzegovinaBrazilBulgariaBurma/MyanmarCabo VerdeCambodiaCameroonCanadaCaribbeanCentral AmericaChileChinaColombiaCongoCosta RicaCroatiaCubaCzechoslovakiaDenmarkDominicaDominican RepublicEastern AfricaEastern AsiaEastern EuropeEcuadorEgyptEl SalvadorEnglandEritreaEthiopiaEuropeFijiFranceGermanyGhanaGreeceGrenadaGuatemalaGuyanaHaitiHondurasHong KongHungaryIndiaIndonesiaIranIraqIrelandIsraelItalyJamaicaJapanJordanKazakhstanKenyaKoreaKuwaitLaosLatin AmericaLatviaLebanonLiberiaLithuaniaMalaysiaMexicoMicronesiaMiddle AfricaMoldovaMoroccoNepalNetherlandsNicaraguaNigeriaNorth AmericaNorth MacedoniaNorthern AfricaNorthern EuropeNorwayOceaniaPakistanPanamaPeruPhilippinesPolandPortugalRomaniaRussiaSaudi ArabiaScotlandSenegalSerbiaSierra LeoneSingaporeSomaliaSouth AfricaSouth AmericaSouth Central AsiaSouth Eastern AsiaSouthern EuropeSpainSri LankaSt. Vincent and the GrenadinesSudanSwedenSwitzerlandSyriaTaiwanThailandTrinidad and TobagoTurkeyUgandaUkraineUruguayUzbekistanVenezuelaVietnamWest IndiesWestern AfricaWestern AsiaWestern EuropeYemenZaireZimbabweAzores
Single Female Poverty
Income
Poverty
Unemployment
Labor Participation
Family Structure
Vehicle Availability
Education Level
Disability

Single Female Poverty Comparison

Portuguese

Immigrants from Hungary

Excellent
Exceptional
20.5%
SINGLE FEMALE POVERTY
81.5/ 100
METRIC RATING
149th/ 347
METRIC RANK
20.2%
SINGLE FEMALE POVERTY
92.3/ 100
METRIC RATING
130th/ 347
METRIC RANK

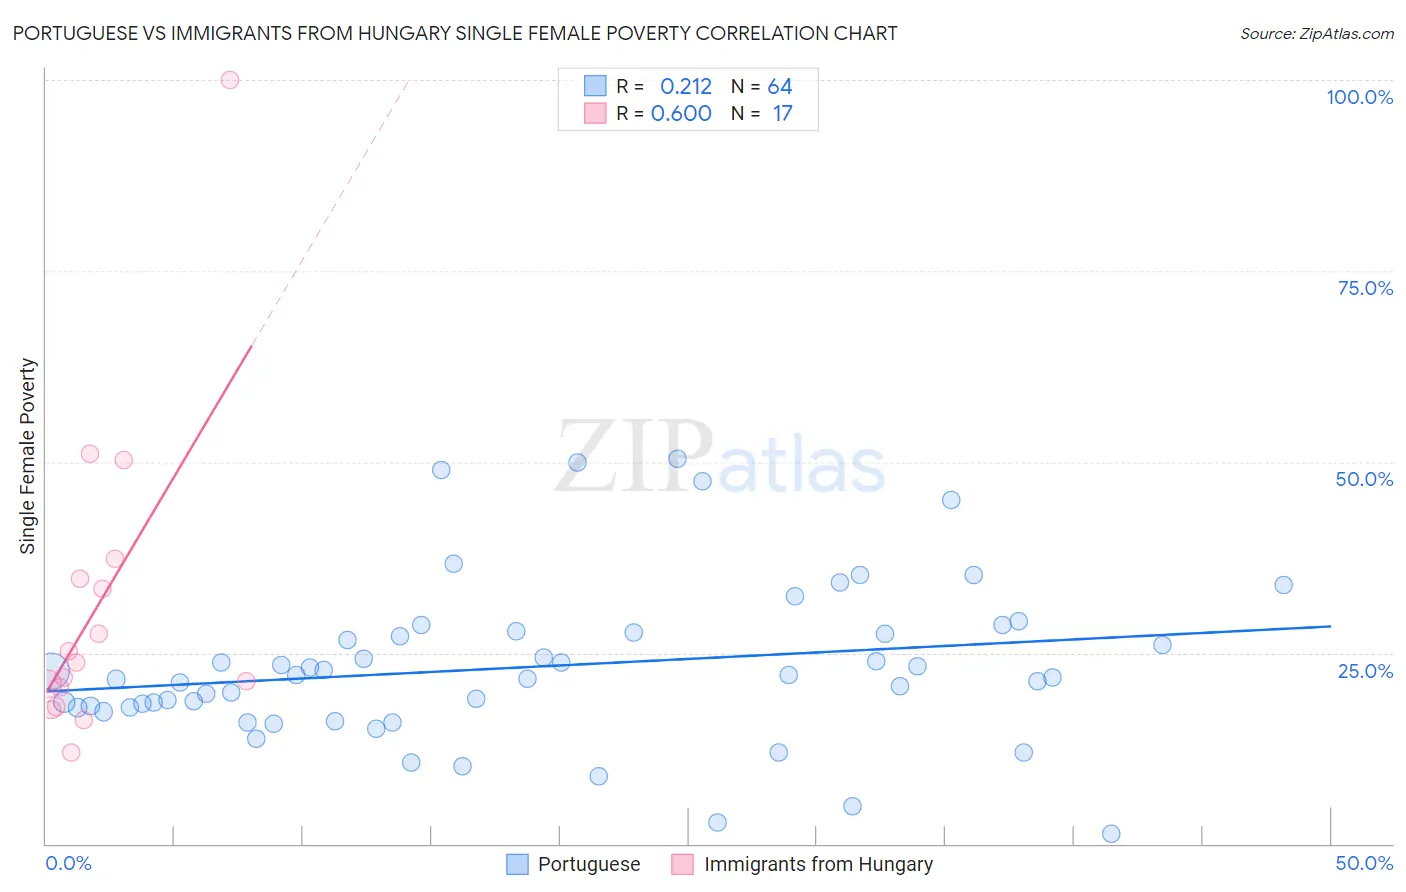
Portuguese vs Immigrants from Hungary Single Female Poverty Correlation Chart

The statistical analysis conducted on geographies consisting of 440,230,754 people shows a weak positive correlation between the proportion of Portuguese and poverty level among single females in the United States with a correlation coefficient (R) of 0.212 and weighted average of 20.5%. Similarly, the statistical analysis conducted on geographies consisting of 193,674,304 people shows a substantial positive correlation between the proportion of Immigrants from Hungary and poverty level among single females in the United States with a correlation coefficient (R) of 0.600 and weighted average of 20.2%, a difference of 1.6%.
Portuguese vs Immigrants from Hungary Single Female Poverty

Single Female Poverty Correlation Summary

MeasurementPortugueseImmigrants from Hungary
Minimum1.2%11.9%
Maximum50.5%100.0%
Range49.2%88.1%
Mean23.2%31.2%
Median22.0%23.7%
Interquartile 25% (IQ1)17.8%19.2%
Interquartile 75% (IQ3)27.5%36.0%
Interquartile Range (IQR)9.7%16.9%
Standard Deviation (Sample)10.4%20.9%
Standard Deviation (Population)10.3%20.3%

Demographics Similar to Portuguese and Immigrants from Hungary by Single Female Poverty

In terms of single female poverty, the demographic groups most similar to Portuguese are Luxembourger (20.4%, a difference of 0.39%), South African (20.4%, a difference of 0.44%), Venezuelan (20.4%, a difference of 0.47%), Austrian (20.4%, a difference of 0.50%), and Immigrants from Uzbekistan (20.3%, a difference of 0.87%). Similarly, the demographic groups most similar to Immigrants from Hungary are Immigrants from Morocco (20.2%, a difference of 0.030%), Pakistani (20.2%, a difference of 0.050%), Uruguayan (20.2%, a difference of 0.050%), Immigrants from England (20.2%, a difference of 0.090%), and Immigrants from Venezuela (20.2%, a difference of 0.18%).
DemographicsRating | RankSingle Female Poverty
Immigrants | Morocco
92.4
/100
|
#129
Exceptional
20.2%
Immigrants | Hungary
92.3
/100
|
#130
Exceptional
20.2%
Pakistanis
92.1
/100
|
#131
Exceptional
20.2%
Uruguayans
92.1
/100
|
#132
Exceptional
20.2%
Immigrants | England
91.9
/100
|
#133
Exceptional
20.2%
Immigrants | Venezuela
91.5
/100
|
#134
Exceptional
20.2%
Immigrants | Iraq
91.2
/100
|
#135
Exceptional
20.2%
Immigrants | Canada
91.2
/100
|
#136
Exceptional
20.2%
Immigrants | Nepal
90.6
/100
|
#137
Exceptional
20.3%
Slovenes
90.5
/100
|
#138
Exceptional
20.3%
Immigrants | Kuwait
90.4
/100
|
#139
Exceptional
20.3%
Syrians
90.4
/100
|
#140
Exceptional
20.3%
Immigrants | North America
89.5
/100
|
#141
Excellent
20.3%
Immigrants | Uganda
89.1
/100
|
#142
Excellent
20.3%
Australians
88.4
/100
|
#143
Excellent
20.3%
Immigrants | Uzbekistan
88.3
/100
|
#144
Excellent
20.3%
Austrians
85.8
/100
|
#145
Excellent
20.4%
Venezuelans
85.5
/100
|
#146
Excellent
20.4%
South Africans
85.3
/100
|
#147
Excellent
20.4%
Luxembourgers
84.9
/100
|
#148
Excellent
20.4%
Portuguese
81.5
/100
|
#149
Excellent
20.5%