Immigrants from the Azores vs Immigrants from Grenada Receiving Food Stamps
COMPARE
Immigrants from the Azores
Immigrants from Grenada
Receiving Food Stamps
Receiving Food Stamps Comparison
Immigrants from the Azores
Immigrants from Grenada
16.4%
RECEIVING FOOD STAMPS
0.0/ 100
METRIC RATING
305th/ 347
METRIC RANK
17.8%
RECEIVING FOOD STAMPS
0.0/ 100
METRIC RATING
322nd/ 347
METRIC RANK
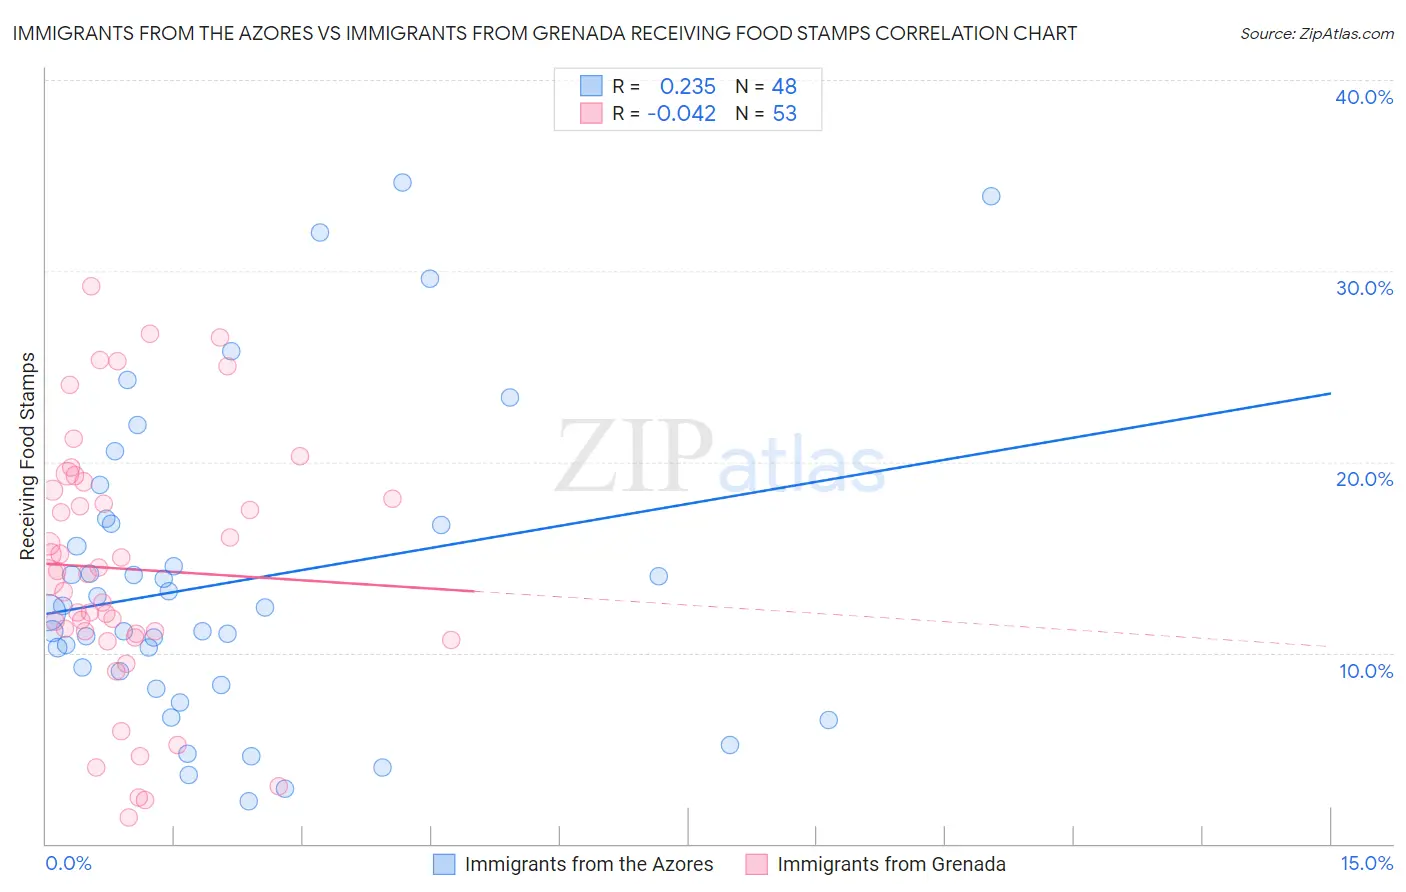
Immigrants from the Azores vs Immigrants from Grenada Receiving Food Stamps Correlation Chart
The statistical analysis conducted on geographies consisting of 46,243,454 people shows a weak positive correlation between the proportion of Immigrants from the Azores and percentage of population receiving government assistance and/or food stamps in the United States with a correlation coefficient (R) of 0.235 and weighted average of 16.4%. Similarly, the statistical analysis conducted on geographies consisting of 67,031,750 people shows no correlation between the proportion of Immigrants from Grenada and percentage of population receiving government assistance and/or food stamps in the United States with a correlation coefficient (R) of -0.042 and weighted average of 17.8%, a difference of 8.5%.
Receiving Food Stamps Correlation Summary
| Measurement | Immigrants from the Azores | Immigrants from Grenada |
| Minimum | 2.2% | 1.4% |
| Maximum | 34.6% | 29.2% |
| Range | 32.4% | 27.8% |
| Mean | 13.7% | 14.4% |
| Median | 12.3% | 14.2% |
| Interquartile 25% (IQ1) | 8.7% | 10.9% |
| Interquartile 75% (IQ3) | 16.7% | 18.7% |
| Interquartile Range (IQR) | 8.1% | 7.8% |
| Standard Deviation (Sample) | 7.9% | 6.7% |
| Standard Deviation (Population) | 7.9% | 6.7% |
Demographics Similar to Immigrants from the Azores and Immigrants from Grenada by Receiving Food Stamps
In terms of receiving food stamps, the demographic groups most similar to Immigrants from the Azores are Jamaican (16.4%, a difference of 0.070%), Houma (16.5%, a difference of 0.35%), Barbadian (16.5%, a difference of 0.62%), U.S. Virgin Islander (16.5%, a difference of 0.86%), and West Indian (16.3%, a difference of 0.88%). Similarly, the demographic groups most similar to Immigrants from Grenada are Haitian (17.8%, a difference of 0.010%), Native/Alaskan (17.3%, a difference of 2.9%), Immigrants from Nicaragua (17.2%, a difference of 3.1%), Immigrants from St. Vincent and the Grenadines (17.2%, a difference of 3.2%), and Menominee (17.2%, a difference of 3.4%).
| Demographics | Rating | Rank | Receiving Food Stamps |
| Nicaraguans | 0.0 /100 | #303 | Tragic 16.1% |
| West Indians | 0.0 /100 | #304 | Tragic 16.3% |
| Immigrants | Azores | 0.0 /100 | #305 | Tragic 16.4% |
| Jamaicans | 0.0 /100 | #306 | Tragic 16.4% |
| Houma | 0.0 /100 | #307 | Tragic 16.5% |
| Barbadians | 0.0 /100 | #308 | Tragic 16.5% |
| U.S. Virgin Islanders | 0.0 /100 | #309 | Tragic 16.5% |
| Immigrants | Barbados | 0.0 /100 | #310 | Tragic 16.6% |
| Guyanese | 0.0 /100 | #311 | Tragic 16.7% |
| Sioux | 0.0 /100 | #312 | Tragic 16.8% |
| Immigrants | Jamaica | 0.0 /100 | #313 | Tragic 16.9% |
| Immigrants | Guyana | 0.0 /100 | #314 | Tragic 16.9% |
| Bahamians | 0.0 /100 | #315 | Tragic 17.0% |
| Central American Indians | 0.0 /100 | #316 | Tragic 17.1% |
| Blacks/African Americans | 0.0 /100 | #317 | Tragic 17.2% |
| Menominee | 0.0 /100 | #318 | Tragic 17.2% |
| Immigrants | St. Vincent and the Grenadines | 0.0 /100 | #319 | Tragic 17.2% |
| Immigrants | Nicaragua | 0.0 /100 | #320 | Tragic 17.2% |
| Natives/Alaskans | 0.0 /100 | #321 | Tragic 17.3% |
| Immigrants | Grenada | 0.0 /100 | #322 | Tragic 17.8% |
| Haitians | 0.0 /100 | #323 | Tragic 17.8% |