Pennsylvania German vs Kiowa Child Poverty Under the Age of 5
COMPARE
Pennsylvania German
Kiowa
Child Poverty Under the Age of 5
Child Poverty Under the Age of 5 Comparison
Pennsylvania Germans
Kiowa
19.8%
CHILD POVERTY UNDER THE AGE OF 5
0.3/ 100
METRIC RATING
251st/ 347
METRIC RANK
24.5%
CHILD POVERTY UNDER THE AGE OF 5
0.0/ 100
METRIC RATING
331st/ 347
METRIC RANK
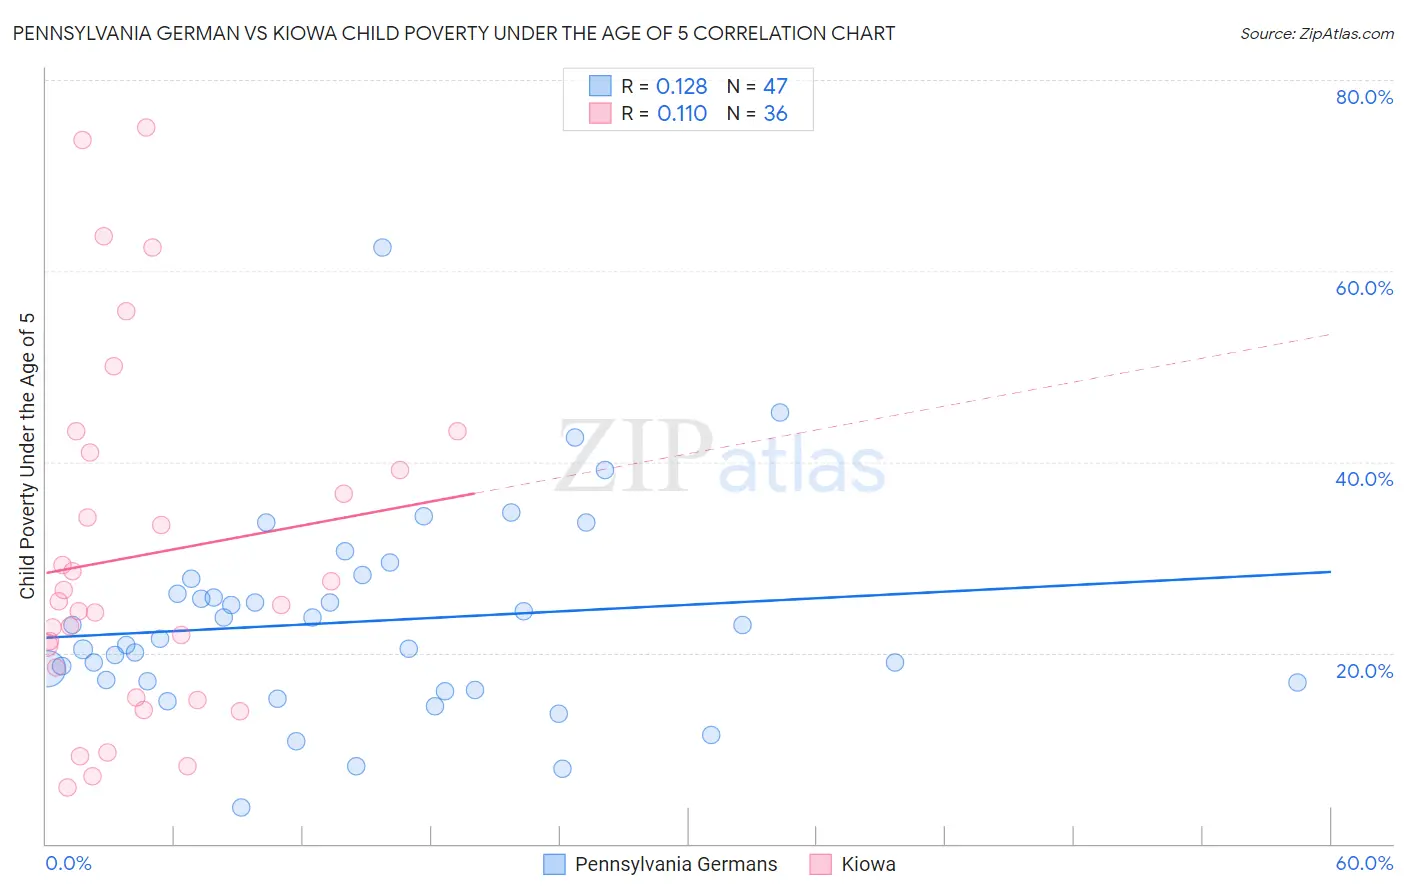
Pennsylvania German vs Kiowa Child Poverty Under the Age of 5 Correlation Chart
The statistical analysis conducted on geographies consisting of 226,788,326 people shows a poor positive correlation between the proportion of Pennsylvania Germans and poverty level among children under the age of 5 in the United States with a correlation coefficient (R) of 0.128 and weighted average of 19.8%. Similarly, the statistical analysis conducted on geographies consisting of 55,875,823 people shows a poor positive correlation between the proportion of Kiowa and poverty level among children under the age of 5 in the United States with a correlation coefficient (R) of 0.110 and weighted average of 24.5%, a difference of 23.7%.
Child Poverty Under the Age of 5 Correlation Summary
| Measurement | Pennsylvania German | Kiowa |
| Minimum | 3.8% | 5.8% |
| Maximum | 62.5% | 75.0% |
| Range | 58.7% | 69.2% |
| Mean | 23.3% | 30.2% |
| Median | 21.4% | 25.2% |
| Interquartile 25% (IQ1) | 16.9% | 16.9% |
| Interquartile 75% (IQ3) | 27.8% | 40.1% |
| Interquartile Range (IQR) | 10.9% | 23.2% |
| Standard Deviation (Sample) | 10.5% | 18.4% |
| Standard Deviation (Population) | 10.4% | 18.1% |
Similar Demographics by Child Poverty Under the Age of 5
Demographics Similar to Pennsylvania Germans by Child Poverty Under the Age of 5
In terms of child poverty under the age of 5, the demographic groups most similar to Pennsylvania Germans are Immigrants from Nicaragua (19.8%, a difference of 0.040%), Nonimmigrants (19.7%, a difference of 0.17%), Immigrants from Middle Africa (19.7%, a difference of 0.22%), Marshallese (19.7%, a difference of 0.24%), and Guyanese (19.7%, a difference of 0.26%).
| Demographics | Rating | Rank | Child Poverty Under the Age of 5 |
| Immigrants | Ghana | 0.5 /100 | #244 | Tragic 19.6% |
| Immigrants | Western Africa | 0.4 /100 | #245 | Tragic 19.7% |
| Cree | 0.4 /100 | #246 | Tragic 19.7% |
| Guyanese | 0.4 /100 | #247 | Tragic 19.7% |
| Marshallese | 0.4 /100 | #248 | Tragic 19.7% |
| Immigrants | Middle Africa | 0.4 /100 | #249 | Tragic 19.7% |
| Immigrants | Nonimmigrants | 0.4 /100 | #250 | Tragic 19.7% |
| Pennsylvania Germans | 0.3 /100 | #251 | Tragic 19.8% |
| Immigrants | Nicaragua | 0.3 /100 | #252 | Tragic 19.8% |
| Mexican American Indians | 0.3 /100 | #253 | Tragic 19.9% |
| Fijians | 0.3 /100 | #254 | Tragic 19.9% |
| Immigrants | Cuba | 0.2 /100 | #255 | Tragic 19.9% |
| Immigrants | Barbados | 0.2 /100 | #256 | Tragic 20.0% |
| Shoshone | 0.2 /100 | #257 | Tragic 20.0% |
| Immigrants | St. Vincent and the Grenadines | 0.2 /100 | #258 | Tragic 20.0% |
Demographics Similar to Kiowa by Child Poverty Under the Age of 5
In terms of child poverty under the age of 5, the demographic groups most similar to Kiowa are Creek (24.2%, a difference of 1.0%), Cajun (24.1%, a difference of 1.5%), Immigrants from Dominican Republic (24.1%, a difference of 1.7%), Dominican (24.0%, a difference of 1.8%), and Apache (25.0%, a difference of 2.2%).
| Demographics | Rating | Rank | Child Poverty Under the Age of 5 |
| Paiute | 0.0 /100 | #324 | Tragic 23.8% |
| Immigrants | Congo | 0.0 /100 | #325 | Tragic 23.9% |
| Central American Indians | 0.0 /100 | #326 | Tragic 23.9% |
| Dominicans | 0.0 /100 | #327 | Tragic 24.0% |
| Immigrants | Dominican Republic | 0.0 /100 | #328 | Tragic 24.1% |
| Cajuns | 0.0 /100 | #329 | Tragic 24.1% |
| Creek | 0.0 /100 | #330 | Tragic 24.2% |
| Kiowa | 0.0 /100 | #331 | Tragic 24.5% |
| Apache | 0.0 /100 | #332 | Tragic 25.0% |
| Natives/Alaskans | 0.0 /100 | #333 | Tragic 25.6% |
| Blacks/African Americans | 0.0 /100 | #334 | Tragic 25.7% |
| Colville | 0.0 /100 | #335 | Tragic 25.7% |
| Sioux | 0.0 /100 | #336 | Tragic 26.9% |
| Pima | 0.0 /100 | #337 | Tragic 27.4% |
| Hopi | 0.0 /100 | #338 | Tragic 27.7% |