Senegalese vs Immigrants from Japan Female Poverty
COMPARE
Senegalese
Immigrants from Japan
Female Poverty
Female Poverty Comparison
Senegalese
Immigrants from Japan
16.5%
FEMALE POVERTY
0.0/ 100
METRIC RATING
295th/ 347
METRIC RANK
11.9%
FEMALE POVERTY
99.0/ 100
METRIC RATING
48th/ 347
METRIC RANK
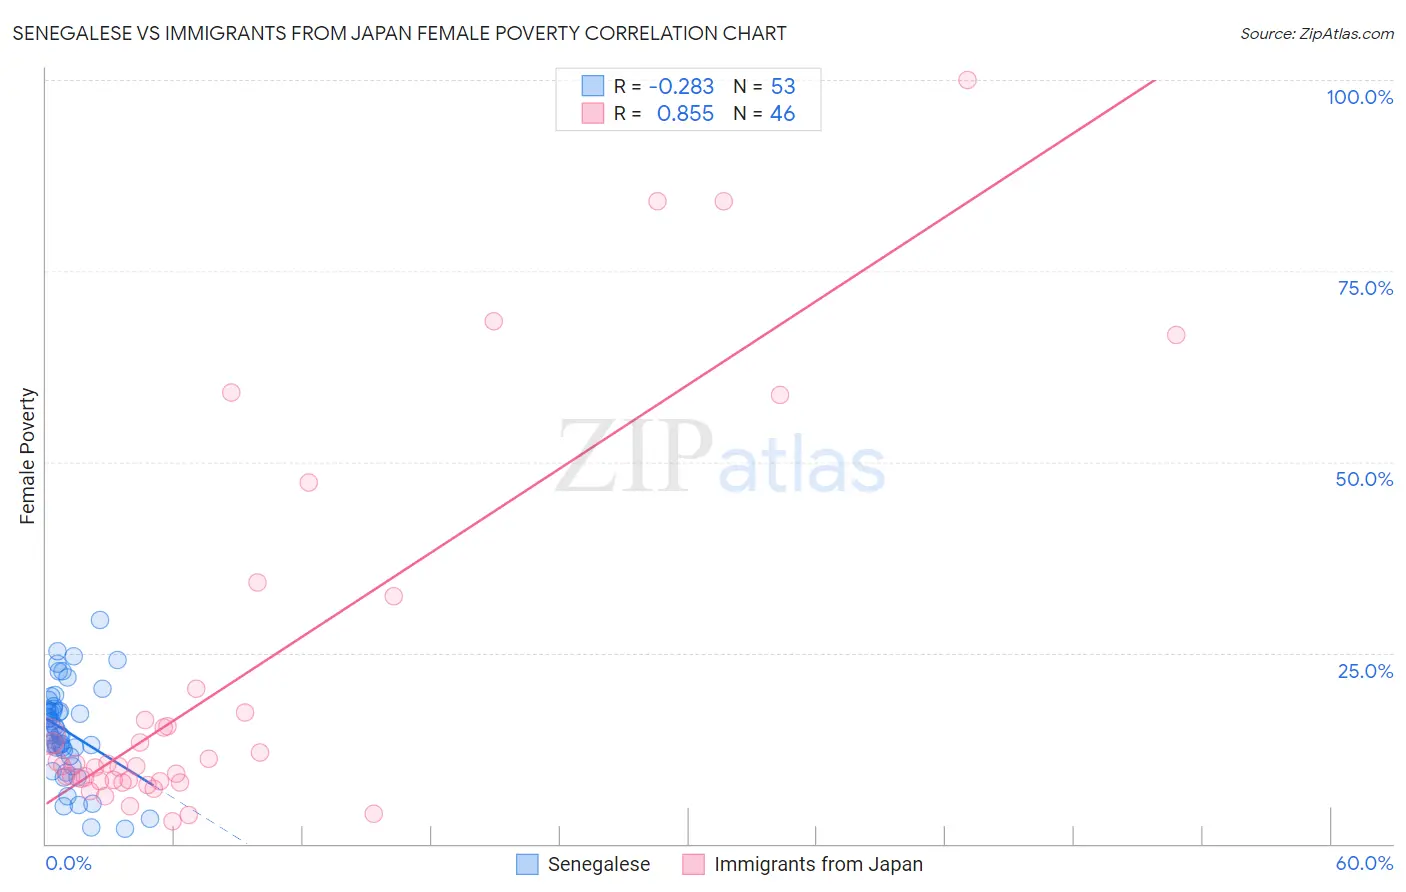
Senegalese vs Immigrants from Japan Female Poverty Correlation Chart
The statistical analysis conducted on geographies consisting of 78,099,565 people shows a weak negative correlation between the proportion of Senegalese and poverty level among females in the United States with a correlation coefficient (R) of -0.283 and weighted average of 16.5%. Similarly, the statistical analysis conducted on geographies consisting of 339,963,649 people shows a very strong positive correlation between the proportion of Immigrants from Japan and poverty level among females in the United States with a correlation coefficient (R) of 0.855 and weighted average of 11.9%, a difference of 37.7%.
Female Poverty Correlation Summary
| Measurement | Senegalese | Immigrants from Japan |
| Minimum | 1.9% | 2.9% |
| Maximum | 29.2% | 100.0% |
| Range | 27.3% | 97.1% |
| Mean | 14.7% | 21.6% |
| Median | 14.5% | 10.3% |
| Interquartile 25% (IQ1) | 11.9% | 8.2% |
| Interquartile 75% (IQ3) | 17.9% | 17.1% |
| Interquartile Range (IQR) | 6.0% | 9.0% |
| Standard Deviation (Sample) | 6.1% | 24.6% |
| Standard Deviation (Population) | 6.0% | 24.4% |
Similar Demographics by Female Poverty
Demographics Similar to Senegalese by Female Poverty
In terms of female poverty, the demographic groups most similar to Senegalese are Immigrants from Senegal (16.5%, a difference of 0.020%), Immigrants from Cabo Verde (16.4%, a difference of 0.080%), Immigrants from Latin America (16.4%, a difference of 0.11%), Immigrants from Zaire (16.4%, a difference of 0.17%), and Yaqui (16.4%, a difference of 0.18%).
| Demographics | Rating | Rank | Female Poverty |
| Indonesians | 0.0 /100 | #288 | Tragic 16.4% |
| Blackfeet | 0.0 /100 | #289 | Tragic 16.4% |
| Immigrants | Bangladesh | 0.0 /100 | #290 | Tragic 16.4% |
| Yaqui | 0.0 /100 | #291 | Tragic 16.4% |
| Immigrants | Zaire | 0.0 /100 | #292 | Tragic 16.4% |
| Immigrants | Latin America | 0.0 /100 | #293 | Tragic 16.4% |
| Immigrants | Cabo Verde | 0.0 /100 | #294 | Tragic 16.4% |
| Senegalese | 0.0 /100 | #295 | Tragic 16.5% |
| Immigrants | Senegal | 0.0 /100 | #296 | Tragic 16.5% |
| Mexicans | 0.0 /100 | #297 | Tragic 16.5% |
| Somalis | 0.0 /100 | #298 | Tragic 16.6% |
| Hispanics or Latinos | 0.0 /100 | #299 | Tragic 16.6% |
| Bahamians | 0.0 /100 | #300 | Tragic 16.6% |
| Guatemalans | 0.0 /100 | #301 | Tragic 16.7% |
| Chippewa | 0.0 /100 | #302 | Tragic 16.7% |
Demographics Similar to Immigrants from Japan by Female Poverty
In terms of female poverty, the demographic groups most similar to Immigrants from Japan are Immigrants from Romania (12.0%, a difference of 0.19%), Slovene (12.0%, a difference of 0.20%), Asian (11.9%, a difference of 0.23%), Immigrants from Bulgaria (12.0%, a difference of 0.42%), and Turkish (11.9%, a difference of 0.44%).
| Demographics | Rating | Rank | Female Poverty |
| Czechs | 99.2 /100 | #41 | Exceptional 11.9% |
| Immigrants | Moldova | 99.2 /100 | #42 | Exceptional 11.9% |
| Koreans | 99.2 /100 | #43 | Exceptional 11.9% |
| Tongans | 99.2 /100 | #44 | Exceptional 11.9% |
| Immigrants | Czechoslovakia | 99.2 /100 | #45 | Exceptional 11.9% |
| Turks | 99.2 /100 | #46 | Exceptional 11.9% |
| Asians | 99.1 /100 | #47 | Exceptional 11.9% |
| Immigrants | Japan | 99.0 /100 | #48 | Exceptional 11.9% |
| Immigrants | Romania | 99.0 /100 | #49 | Exceptional 12.0% |
| Slovenes | 98.9 /100 | #50 | Exceptional 12.0% |
| Immigrants | Bulgaria | 98.9 /100 | #51 | Exceptional 12.0% |
| Immigrants | Croatia | 98.7 /100 | #52 | Exceptional 12.0% |
| Immigrants | Austria | 98.7 /100 | #53 | Exceptional 12.0% |
| Immigrants | Philippines | 98.7 /100 | #54 | Exceptional 12.1% |
| Immigrants | Sri Lanka | 98.5 /100 | #55 | Exceptional 12.1% |