Panamanian vs Immigrants from Jordan Median Family Income
COMPARE
Panamanian
Immigrants from Jordan
Median Family Income
Median Family Income Comparison
Panamanians
Immigrants from Jordan
$97,683
MEDIAN FAMILY INCOME
7.2/ 100
METRIC RATING
212th/ 347
METRIC RANK
$107,715
MEDIAN FAMILY INCOME
92.9/ 100
METRIC RATING
122nd/ 347
METRIC RANK
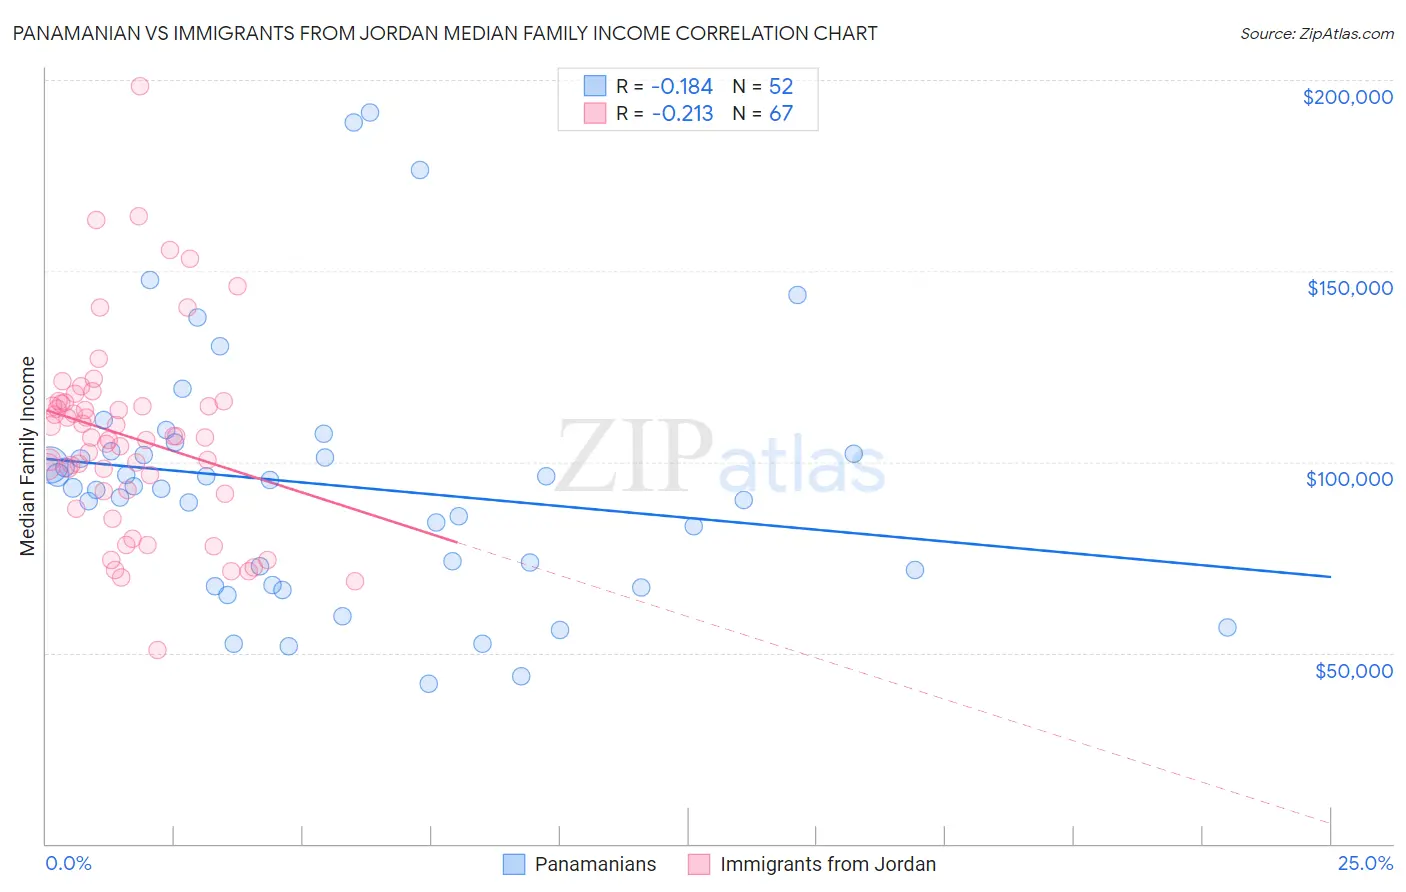
Panamanian vs Immigrants from Jordan Median Family Income Correlation Chart
The statistical analysis conducted on geographies consisting of 281,027,872 people shows a poor negative correlation between the proportion of Panamanians and median family income in the United States with a correlation coefficient (R) of -0.184 and weighted average of $97,683. Similarly, the statistical analysis conducted on geographies consisting of 181,223,835 people shows a weak negative correlation between the proportion of Immigrants from Jordan and median family income in the United States with a correlation coefficient (R) of -0.213 and weighted average of $107,715, a difference of 10.3%.
Median Family Income Correlation Summary
| Measurement | Panamanian | Immigrants from Jordan |
| Minimum | $41,845 | $50,608 |
| Maximum | $191,635 | $198,467 |
| Range | $149,790 | $147,858 |
| Mean | $93,845 | $106,593 |
| Median | $93,176 | $106,540 |
| Interquartile 25% (IQ1) | $69,694 | $92,338 |
| Interquartile 75% (IQ3) | $102,381 | $115,517 |
| Interquartile Range (IQR) | $32,687 | $23,179 |
| Standard Deviation (Sample) | $33,147 | $25,689 |
| Standard Deviation (Population) | $32,827 | $25,497 |
Similar Demographics by Median Family Income
Demographics Similar to Panamanians by Median Family Income
In terms of median family income, the demographic groups most similar to Panamanians are Immigrants from Sudan ($97,737, a difference of 0.050%), Immigrants from Armenia ($97,605, a difference of 0.080%), Bermudan ($97,577, a difference of 0.11%), Nigerian ($97,522, a difference of 0.17%), and Immigrants from Bosnia and Herzegovina ($97,432, a difference of 0.26%).
| Demographics | Rating | Rank | Median Family Income |
| Hawaiians | 12.5 /100 | #205 | Poor $98,869 |
| Immigrants | Iraq | 12.1 /100 | #206 | Poor $98,786 |
| Aleuts | 11.6 /100 | #207 | Poor $98,702 |
| Immigrants | Uruguay | 9.2 /100 | #208 | Tragic $98,205 |
| Immigrants | Colombia | 8.7 /100 | #209 | Tragic $98,067 |
| Puget Sound Salish | 8.2 /100 | #210 | Tragic $97,958 |
| Immigrants | Sudan | 7.4 /100 | #211 | Tragic $97,737 |
| Panamanians | 7.2 /100 | #212 | Tragic $97,683 |
| Immigrants | Armenia | 7.0 /100 | #213 | Tragic $97,605 |
| Bermudans | 6.9 /100 | #214 | Tragic $97,577 |
| Nigerians | 6.7 /100 | #215 | Tragic $97,522 |
| Immigrants | Bosnia and Herzegovina | 6.4 /100 | #216 | Tragic $97,432 |
| Japanese | 6.0 /100 | #217 | Tragic $97,288 |
| Immigrants | Cambodia | 5.8 /100 | #218 | Tragic $97,222 |
| Delaware | 5.1 /100 | #219 | Tragic $96,958 |
Demographics Similar to Immigrants from Jordan by Median Family Income
In terms of median family income, the demographic groups most similar to Immigrants from Jordan are Carpatho Rusyn ($107,502, a difference of 0.20%), Pakistani ($107,390, a difference of 0.30%), European ($108,099, a difference of 0.36%), Taiwanese ($107,295, a difference of 0.39%), and Immigrants from Northern Africa ($108,161, a difference of 0.41%).
| Demographics | Rating | Rank | Median Family Income |
| Swedes | 95.1 /100 | #115 | Exceptional $108,499 |
| Chileans | 95.0 /100 | #116 | Exceptional $108,429 |
| Immigrants | Philippines | 94.6 /100 | #117 | Exceptional $108,288 |
| Ethiopians | 94.5 /100 | #118 | Exceptional $108,251 |
| Sri Lankans | 94.5 /100 | #119 | Exceptional $108,234 |
| Immigrants | Northern Africa | 94.3 /100 | #120 | Exceptional $108,161 |
| Europeans | 94.1 /100 | #121 | Exceptional $108,099 |
| Immigrants | Jordan | 92.9 /100 | #122 | Exceptional $107,715 |
| Carpatho Rusyns | 92.2 /100 | #123 | Exceptional $107,502 |
| Pakistanis | 91.7 /100 | #124 | Exceptional $107,390 |
| Taiwanese | 91.4 /100 | #125 | Exceptional $107,295 |
| Serbians | 90.8 /100 | #126 | Exceptional $107,157 |
| Lebanese | 90.5 /100 | #127 | Exceptional $107,086 |
| Immigrants | Ethiopia | 90.0 /100 | #128 | Excellent $106,969 |
| Arabs | 89.9 /100 | #129 | Excellent $106,952 |