Panamanian vs Immigrants from Jordan In Labor Force | Age 30-34
COMPARE
Panamanian
Immigrants from Jordan
In Labor Force | Age 30-34
In Labor Force | Age 30-34 Comparison
Panamanians
Immigrants from Jordan
84.2%
IN LABOR FORCE | AGE 30-34
3.8/ 100
METRIC RATING
222nd/ 347
METRIC RANK
85.0%
IN LABOR FORCE | AGE 30-34
91.5/ 100
METRIC RATING
125th/ 347
METRIC RANK
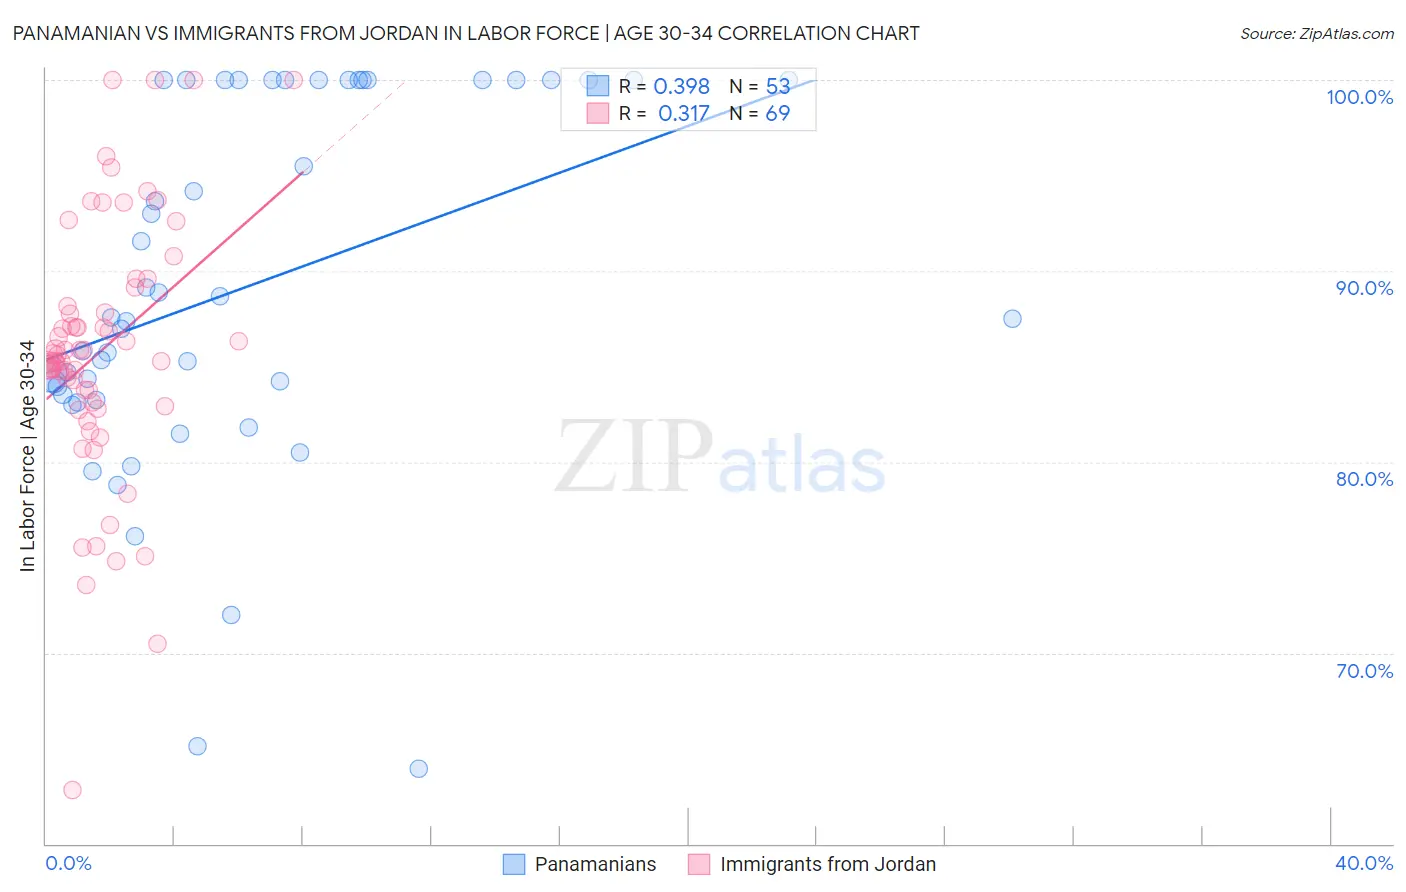
Panamanian vs Immigrants from Jordan In Labor Force | Age 30-34 Correlation Chart
The statistical analysis conducted on geographies consisting of 281,117,807 people shows a mild positive correlation between the proportion of Panamanians and labor force participation rate among population between the ages 30 and 34 in the United States with a correlation coefficient (R) of 0.398 and weighted average of 84.2%. Similarly, the statistical analysis conducted on geographies consisting of 181,256,193 people shows a mild positive correlation between the proportion of Immigrants from Jordan and labor force participation rate among population between the ages 30 and 34 in the United States with a correlation coefficient (R) of 0.317 and weighted average of 85.0%, a difference of 0.99%.
In Labor Force | Age 30-34 Correlation Summary
| Measurement | Panamanian | Immigrants from Jordan |
| Minimum | 63.9% | 62.8% |
| Maximum | 100.0% | 100.0% |
| Range | 36.1% | 37.2% |
| Mean | 89.1% | 85.8% |
| Median | 87.5% | 85.6% |
| Interquartile 25% (IQ1) | 83.4% | 83.0% |
| Interquartile 75% (IQ3) | 100.0% | 88.6% |
| Interquartile Range (IQR) | 16.6% | 5.6% |
| Standard Deviation (Sample) | 9.4% | 6.8% |
| Standard Deviation (Population) | 9.3% | 6.8% |
Similar Demographics by In Labor Force | Age 30-34
Demographics Similar to Panamanians by In Labor Force | Age 30-34
In terms of in labor force | age 30-34, the demographic groups most similar to Panamanians are Salvadoran (84.2%, a difference of 0.0%), Immigrants from Laos (84.2%, a difference of 0.010%), Cuban (84.2%, a difference of 0.020%), Scottish (84.2%, a difference of 0.040%), and Immigrants from El Salvador (84.2%, a difference of 0.040%).
| Demographics | Rating | Rank | In Labor Force | Age 30-34 |
| Europeans | 7.2 /100 | #215 | Tragic 84.3% |
| Immigrants | Ecuador | 7.1 /100 | #216 | Tragic 84.3% |
| Immigrants | Trinidad and Tobago | 7.0 /100 | #217 | Tragic 84.3% |
| Immigrants | Panama | 6.3 /100 | #218 | Tragic 84.3% |
| Swiss | 5.8 /100 | #219 | Tragic 84.3% |
| Danes | 5.3 /100 | #220 | Tragic 84.3% |
| Salvadorans | 3.8 /100 | #221 | Tragic 84.2% |
| Panamanians | 3.8 /100 | #222 | Tragic 84.2% |
| Immigrants | Laos | 3.6 /100 | #223 | Tragic 84.2% |
| Cubans | 3.4 /100 | #224 | Tragic 84.2% |
| Scottish | 3.1 /100 | #225 | Tragic 84.2% |
| Immigrants | El Salvador | 3.0 /100 | #226 | Tragic 84.2% |
| Immigrants | Cuba | 3.0 /100 | #227 | Tragic 84.2% |
| Immigrants | Haiti | 2.8 /100 | #228 | Tragic 84.2% |
| Welsh | 2.7 /100 | #229 | Tragic 84.2% |
Demographics Similar to Immigrants from Jordan by In Labor Force | Age 30-34
In terms of in labor force | age 30-34, the demographic groups most similar to Immigrants from Jordan are Australian (85.0%, a difference of 0.010%), Austrian (85.0%, a difference of 0.010%), Armenian (85.0%, a difference of 0.020%), Slavic (85.0%, a difference of 0.020%), and Immigrants from Argentina (85.0%, a difference of 0.020%).
| Demographics | Rating | Rank | In Labor Force | Age 30-34 |
| Immigrants | Malaysia | 94.2 /100 | #118 | Exceptional 85.1% |
| Asians | 93.4 /100 | #119 | Exceptional 85.1% |
| Immigrants | Southern Europe | 93.3 /100 | #120 | Exceptional 85.1% |
| Immigrants | Egypt | 93.2 /100 | #121 | Exceptional 85.1% |
| Immigrants | Kuwait | 92.6 /100 | #122 | Exceptional 85.1% |
| Armenians | 92.2 /100 | #123 | Exceptional 85.0% |
| Australians | 92.0 /100 | #124 | Exceptional 85.0% |
| Immigrants | Jordan | 91.5 /100 | #125 | Exceptional 85.0% |
| Austrians | 90.9 /100 | #126 | Exceptional 85.0% |
| Slavs | 90.7 /100 | #127 | Exceptional 85.0% |
| Immigrants | Argentina | 90.6 /100 | #128 | Exceptional 85.0% |
| Immigrants | Western Africa | 90.2 /100 | #129 | Exceptional 85.0% |
| Immigrants | Spain | 90.0 /100 | #130 | Exceptional 85.0% |
| Chinese | 89.6 /100 | #131 | Excellent 85.0% |
| Immigrants | Israel | 89.5 /100 | #132 | Excellent 85.0% |