Spanish vs Immigrants from Jordan Family Poverty

COMPARE

Spanish
Race
Ancestry
AfghanAfricanAlaska NativeAlaskan AthabascanAlbanianAleutAlsatianAmericanApacheArabArapahoArgentineanArmenianAssyrian/Chaldean/SyriacAustralianAustrianBahamianBangladeshiBarbadianBasqueBelgianBelizeanBermudanBhutaneseBlackfeetBolivianBrazilianBritishBritish West IndianBulgarianBurmeseCajunCambodianCanadianCape VerdeanCarpatho RusynCelticCentral AmericanCentral American IndianCherokeeCheyenneChickasawChileanChineseChippewaChoctawColombianColvilleComancheCosta RicanCreeCreekCroatianCrowCubanCypriotCzechCzechoslovakianDanishDelawareDominicanDutchDutch West IndianEastern EuropeanEcuadorianEgyptianEnglishEstonianEthiopianEuropeanFijianFilipinoFinnishFrenchFrench American IndianFrench CanadianGermanGerman RussianGhanaianGreekGuamanian/ChamorroGuatemalanGuyaneseHaitianHmongHonduranHopiHoumaHungarianIcelanderIndian (Asian)IndonesianInupiatIranianIraqiIrishIroquoisIsraeliItalianJamaicanJapaneseJordanianKenyanKiowaKoreanLaotianLatvianLebaneseLiberianLithuanianLumbeeLuxembourgerMacedonianMalaysianMalteseMarshalleseMenomineeMexicanMexican American IndianMongolianMoroccanNative HawaiianNavajoNepaleseNew ZealanderNicaraguanNigerianNorthern EuropeanNorwegianOkinawanOsageOttawaPaiutePakistaniPalestinianPanamanianParaguayanPennsylvania GermanPeruvianPimaPolishPortuguesePotawatomiPuebloPuerto RicanPuget Sound SalishRomanianRussianSalvadoranSamoanScandinavianScotch-IrishScottishSeminoleSenegaleseSerbianShoshoneSierra LeoneanSiouxSlavicSlovakSloveneSomaliSouth AfricanSouth AmericanSouth American IndianSoviet UnionSpaniardSpanishSpanish AmericanSpanish American IndianSri LankanSubsaharan AfricanSudaneseSwedishSwissSyrianTaiwaneseThaiTlingit-HaidaTohono O'OdhamTonganTrinidadian and TobagonianTsimshianTurkishU.S. Virgin IslanderUgandanUkrainianUruguayanUteVenezuelanVietnameseWelshWest IndianYakamaYaquiYugoslavianYumanYup'ikZimbabwean
Immigration
NonimmigrantsImmigrantsAfghanistanAfricaAlbaniaArgentinaArmeniaAsiaAustraliaAustriaBahamasBangladeshBarbadosBelarusBelgiumBelizeBoliviaBosnia and HerzegovinaBrazilBulgariaBurma/MyanmarCabo VerdeCambodiaCameroonCanadaCaribbeanCentral AmericaChileChinaColombiaCongoCosta RicaCroatiaCubaCzechoslovakiaDenmarkDominicaDominican RepublicEastern AfricaEastern AsiaEastern EuropeEcuadorEgyptEl SalvadorEnglandEritreaEthiopiaEuropeFijiFranceGermanyGhanaGreeceGrenadaGuatemalaGuyanaHaitiHondurasHong KongHungaryIndiaIndonesiaIranIraqIrelandIsraelItalyJamaicaJapanKazakhstanKenyaKoreaKuwaitLaosLatin AmericaLatviaLebanonLiberiaLithuaniaMalaysiaMexicoMicronesiaMiddle AfricaMoldovaMoroccoNepalNetherlandsNicaraguaNigeriaNorth AmericaNorth MacedoniaNorthern AfricaNorthern EuropeNorwayOceaniaPakistanPanamaPeruPhilippinesPolandPortugalRomaniaRussiaSaudi ArabiaScotlandSenegalSerbiaSierra LeoneSingaporeSomaliaSouth AfricaSouth AmericaSouth Central AsiaSouth Eastern AsiaSouthern EuropeSpainSri LankaSt. Vincent and the GrenadinesSudanSwedenSwitzerlandSyriaTaiwanThailandTrinidad and TobagoTurkeyUgandaUkraineUruguayUzbekistanVenezuelaVietnamWest IndiesWestern AfricaWestern AsiaWestern EuropeYemenZaireZimbabweAzores
Immigrants from Jordan
Race
Ancestry
AfghanAfricanAlaska NativeAlaskan AthabascanAlbanianAleutAlsatianAmericanApacheArabArapahoArgentineanArmenianAssyrian/Chaldean/SyriacAustralianAustrianBahamianBangladeshiBarbadianBasqueBelgianBelizeanBermudanBhutaneseBlackfeetBolivianBrazilianBritishBritish West IndianBulgarianBurmeseCajunCambodianCanadianCape VerdeanCarpatho RusynCelticCentral AmericanCentral American IndianCherokeeCheyenneChickasawChileanChineseChippewaChoctawColombianColvilleComancheCosta RicanCreeCreekCroatianCrowCubanCypriotCzechCzechoslovakianDanishDelawareDominicanDutchDutch West IndianEastern EuropeanEcuadorianEgyptianEnglishEstonianEthiopianEuropeanFijianFilipinoFinnishFrenchFrench American IndianFrench CanadianGermanGerman RussianGhanaianGreekGuamanian/ChamorroGuatemalanGuyaneseHaitianHmongHonduranHopiHoumaHungarianIcelanderIndian (Asian)IndonesianInupiatIranianIraqiIrishIroquoisIsraeliItalianJamaicanJapaneseJordanianKenyanKiowaKoreanLaotianLatvianLebaneseLiberianLithuanianLumbeeLuxembourgerMacedonianMalaysianMalteseMarshalleseMenomineeMexicanMexican American IndianMongolianMoroccanNative HawaiianNavajoNepaleseNew ZealanderNicaraguanNigerianNorthern EuropeanNorwegianOkinawanOsageOttawaPaiutePakistaniPalestinianPanamanianParaguayanPennsylvania GermanPeruvianPimaPolishPortuguesePotawatomiPuebloPuerto RicanPuget Sound SalishRomanianRussianSalvadoranSamoanScandinavianScotch-IrishScottishSeminoleSenegaleseSerbianShoshoneSierra LeoneanSiouxSlavicSlovakSloveneSomaliSouth AfricanSouth AmericanSouth American IndianSoviet UnionSpaniardSpanish AmericanSpanish American IndianSri LankanSubsaharan AfricanSudaneseSwedishSwissSyrianTaiwaneseThaiTlingit-HaidaTohono O'OdhamTonganTrinidadian and TobagonianTsimshianTurkishU.S. Virgin IslanderUgandanUkrainianUruguayanUteVenezuelanVietnameseWelshWest IndianYakamaYaquiYugoslavianYumanYup'ikZimbabwean
Immigration
NonimmigrantsImmigrantsAfghanistanAfricaAlbaniaArgentinaArmeniaAsiaAustraliaAustriaBahamasBangladeshBarbadosBelarusBelgiumBelizeBoliviaBosnia and HerzegovinaBrazilBulgariaBurma/MyanmarCabo VerdeCambodiaCameroonCanadaCaribbeanCentral AmericaChileChinaColombiaCongoCosta RicaCroatiaCubaCzechoslovakiaDenmarkDominicaDominican RepublicEastern AfricaEastern AsiaEastern EuropeEcuadorEgyptEl SalvadorEnglandEritreaEthiopiaEuropeFijiFranceGermanyGhanaGreeceGrenadaGuatemalaGuyanaHaitiHondurasHong KongHungaryIndiaIndonesiaIranIraqIrelandIsraelItalyJamaicaJapanJordanKazakhstanKenyaKoreaKuwaitLaosLatin AmericaLatviaLebanonLiberiaLithuaniaMalaysiaMexicoMicronesiaMiddle AfricaMoldovaMoroccoNepalNetherlandsNicaraguaNigeriaNorth AmericaNorth MacedoniaNorthern AfricaNorthern EuropeNorwayOceaniaPakistanPanamaPeruPhilippinesPolandPortugalRomaniaRussiaSaudi ArabiaScotlandSenegalSerbiaSierra LeoneSingaporeSomaliaSouth AfricaSouth AmericaSouth Central AsiaSouth Eastern AsiaSouthern EuropeSpainSri LankaSt. Vincent and the GrenadinesSudanSwedenSwitzerlandSyriaTaiwanThailandTrinidad and TobagoTurkeyUgandaUkraineUruguayUzbekistanVenezuelaVietnamWest IndiesWestern AfricaWestern AsiaWestern EuropeYemenZaireZimbabweAzores
Family Poverty
Income
Poverty
Unemployment
Labor Participation
Family Structure
Vehicle Availability
Education Level
Disability

Family Poverty Comparison

Spanish

Immigrants from Jordan

Fair
Excellent
9.3%
FAMILY POVERTY
28.7/ 100
METRIC RATING
192nd/ 347
METRIC RANK
8.5%
FAMILY POVERTY
83.0/ 100
METRIC RATING
147th/ 347
METRIC RANK

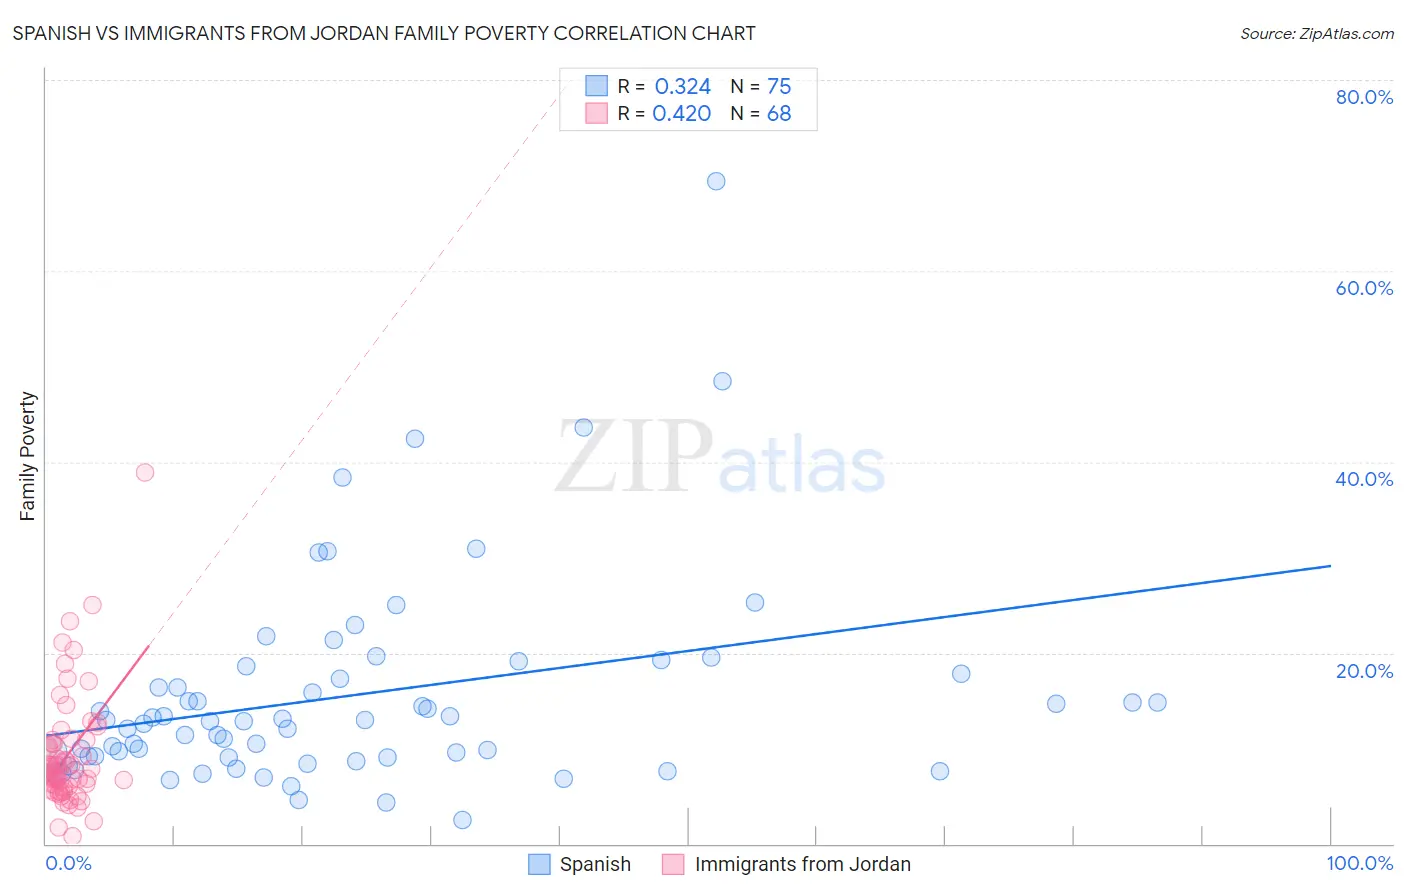
Spanish vs Immigrants from Jordan Family Poverty Correlation Chart

The statistical analysis conducted on geographies consisting of 421,086,812 people shows a mild positive correlation between the proportion of Spanish and poverty level among families in the United States with a correlation coefficient (R) of 0.324 and weighted average of 9.3%. Similarly, the statistical analysis conducted on geographies consisting of 181,199,618 people shows a moderate positive correlation between the proportion of Immigrants from Jordan and poverty level among families in the United States with a correlation coefficient (R) of 0.420 and weighted average of 8.5%, a difference of 8.6%.
Spanish vs Immigrants from Jordan Family Poverty

Family Poverty Correlation Summary

MeasurementSpanishImmigrants from Jordan
Minimum2.5%0.79%
Maximum69.4%38.9%
Range66.9%38.1%
Mean15.5%9.3%
Median12.8%7.6%
Interquartile 25% (IQ1)9.0%6.0%
Interquartile 75% (IQ3)17.8%10.7%
Interquartile Range (IQR)8.8%4.7%
Standard Deviation (Sample)11.0%6.1%
Standard Deviation (Population)11.0%6.0%

Similar Demographics by Family Poverty

Demographics Similar to Spanish by Family Poverty

In terms of family poverty, the demographic groups most similar to Spanish are Ugandan (9.3%, a difference of 0.010%), Immigrants from Western Asia (9.3%, a difference of 0.070%), South American (9.3%, a difference of 0.090%), Venezuelan (9.3%, a difference of 0.21%), and Arab (9.2%, a difference of 0.42%).
DemographicsRating | RankFamily Poverty
Immigrants | Saudi Arabia
38.6
/100
|
#185
Fair
9.1%
Colombians
36.1
/100
|
#186
Fair
9.2%
Delaware
35.4
/100
|
#187
Fair
9.2%
Immigrants | Kenya
34.0
/100
|
#188
Fair
9.2%
Immigrants | Afghanistan
32.1
/100
|
#189
Fair
9.2%
Arabs
31.5
/100
|
#190
Fair
9.2%
Ugandans
28.7
/100
|
#191
Fair
9.3%
Spanish
28.7
/100
|
#192
Fair
9.3%
Immigrants | Western Asia
28.2
/100
|
#193
Fair
9.3%
South Americans
28.1
/100
|
#194
Fair
9.3%
Venezuelans
27.4
/100
|
#195
Fair
9.3%
Immigrants | Venezuela
26.1
/100
|
#196
Fair
9.3%
Immigrants | Colombia
24.4
/100
|
#197
Fair
9.3%
Iraqis
24.2
/100
|
#198
Fair
9.3%
Spaniards
22.8
/100
|
#199
Fair
9.4%

Demographics Similar to Immigrants from Jordan by Family Poverty

In terms of family poverty, the demographic groups most similar to Immigrants from Jordan are Immigrants from Belarus (8.5%, a difference of 0.030%), Immigrants from South Eastern Asia (8.5%, a difference of 0.050%), Albanian (8.5%, a difference of 0.060%), Immigrants from Germany (8.5%, a difference of 0.080%), and Yugoslavian (8.5%, a difference of 0.12%).
DemographicsRating | RankFamily Poverty
Immigrants | Kazakhstan
84.1
/100
|
#140
Excellent
8.5%
Immigrants | Ukraine
83.9
/100
|
#141
Excellent
8.5%
Yugoslavians
83.5
/100
|
#142
Excellent
8.5%
Immigrants | Germany
83.3
/100
|
#143
Excellent
8.5%
Albanians
83.3
/100
|
#144
Excellent
8.5%
Immigrants | South Eastern Asia
83.2
/100
|
#145
Excellent
8.5%
Immigrants | Belarus
83.2
/100
|
#146
Excellent
8.5%
Immigrants | Jordan
83.0
/100
|
#147
Excellent
8.5%
Scotch-Irish
82.2
/100
|
#148
Excellent
8.6%
Mongolians
80.4
/100
|
#149
Excellent
8.6%
Syrians
80.3
/100
|
#150
Excellent
8.6%
Brazilians
80.1
/100
|
#151
Excellent
8.6%
Samoans
79.8
/100
|
#152
Good
8.6%
Immigrants | Spain
79.1
/100
|
#153
Good
8.6%
Immigrants | Vietnam
75.4
/100
|
#154
Good
8.7%