Pakistani vs Ottawa Receiving Food Stamps
COMPARE
Pakistani
Ottawa
Receiving Food Stamps
Receiving Food Stamps Comparison
Pakistanis
Ottawa
10.4%
RECEIVING FOOD STAMPS
95.9/ 100
METRIC RATING
110th/ 347
METRIC RANK
13.1%
RECEIVING FOOD STAMPS
3.5/ 100
METRIC RATING
229th/ 347
METRIC RANK
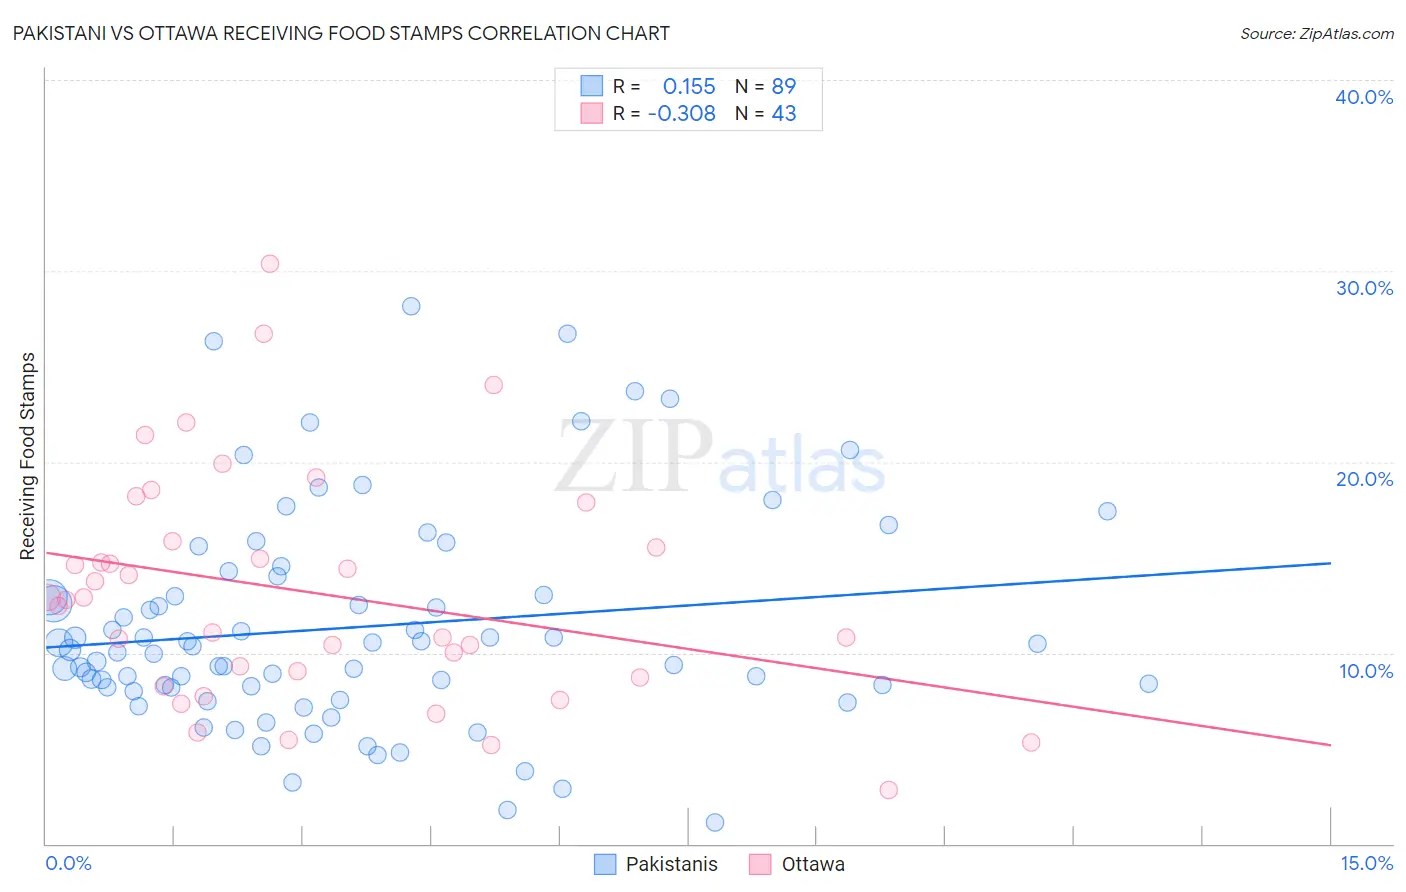
Pakistani vs Ottawa Receiving Food Stamps Correlation Chart
The statistical analysis conducted on geographies consisting of 334,714,196 people shows a poor positive correlation between the proportion of Pakistanis and percentage of population receiving government assistance and/or food stamps in the United States with a correlation coefficient (R) of 0.155 and weighted average of 10.4%. Similarly, the statistical analysis conducted on geographies consisting of 49,940,459 people shows a mild negative correlation between the proportion of Ottawa and percentage of population receiving government assistance and/or food stamps in the United States with a correlation coefficient (R) of -0.308 and weighted average of 13.1%, a difference of 25.5%.
Receiving Food Stamps Correlation Summary
| Measurement | Pakistani | Ottawa |
| Minimum | 1.1% | 2.8% |
| Maximum | 28.2% | 30.4% |
| Range | 27.1% | 27.6% |
| Mean | 11.3% | 13.1% |
| Median | 10.1% | 12.8% |
| Interquartile 25% (IQ1) | 8.2% | 8.7% |
| Interquartile 75% (IQ3) | 13.5% | 15.9% |
| Interquartile Range (IQR) | 5.3% | 7.2% |
| Standard Deviation (Sample) | 5.6% | 6.0% |
| Standard Deviation (Population) | 5.6% | 6.0% |
Similar Demographics by Receiving Food Stamps
Demographics Similar to Pakistanis by Receiving Food Stamps
In terms of receiving food stamps, the demographic groups most similar to Pakistanis are Romanian (10.4%, a difference of 0.10%), Mongolian (10.5%, a difference of 0.11%), Immigrants from Pakistan (10.4%, a difference of 0.28%), Carpatho Rusyn (10.4%, a difference of 0.33%), and Korean (10.4%, a difference of 0.36%).
| Demographics | Rating | Rank | Receiving Food Stamps |
| Immigrants | Latvia | 96.8 /100 | #103 | Exceptional 10.3% |
| Immigrants | Hungary | 96.7 /100 | #104 | Exceptional 10.3% |
| Immigrants | Malaysia | 96.5 /100 | #105 | Exceptional 10.4% |
| Immigrants | Italy | 96.4 /100 | #106 | Exceptional 10.4% |
| Koreans | 96.3 /100 | #107 | Exceptional 10.4% |
| Carpatho Rusyns | 96.2 /100 | #108 | Exceptional 10.4% |
| Immigrants | Pakistan | 96.2 /100 | #109 | Exceptional 10.4% |
| Pakistanis | 95.9 /100 | #110 | Exceptional 10.4% |
| Romanians | 95.8 /100 | #111 | Exceptional 10.4% |
| Mongolians | 95.8 /100 | #112 | Exceptional 10.5% |
| Icelanders | 95.4 /100 | #113 | Exceptional 10.5% |
| Scotch-Irish | 95.1 /100 | #114 | Exceptional 10.5% |
| Immigrants | Saudi Arabia | 94.9 /100 | #115 | Exceptional 10.5% |
| Canadians | 94.8 /100 | #116 | Exceptional 10.5% |
| Immigrants | Nepal | 94.6 /100 | #117 | Exceptional 10.6% |
Demographics Similar to Ottawa by Receiving Food Stamps
In terms of receiving food stamps, the demographic groups most similar to Ottawa are Panamanian (13.1%, a difference of 0.010%), Nigerian (13.1%, a difference of 0.020%), Puget Sound Salish (13.1%, a difference of 0.050%), Chickasaw (13.1%, a difference of 0.070%), and Immigrants from Nigeria (13.1%, a difference of 0.090%).
| Demographics | Rating | Rank | Receiving Food Stamps |
| Immigrants | Immigrants | 4.4 /100 | #222 | Tragic 13.0% |
| Immigrants | Albania | 4.4 /100 | #223 | Tragic 13.0% |
| Immigrants | Armenia | 4.3 /100 | #224 | Tragic 13.0% |
| Fijians | 4.3 /100 | #225 | Tragic 13.0% |
| Chickasaw | 3.6 /100 | #226 | Tragic 13.1% |
| Nigerians | 3.5 /100 | #227 | Tragic 13.1% |
| Panamanians | 3.5 /100 | #228 | Tragic 13.1% |
| Ottawa | 3.5 /100 | #229 | Tragic 13.1% |
| Puget Sound Salish | 3.4 /100 | #230 | Tragic 13.1% |
| Immigrants | Nigeria | 3.4 /100 | #231 | Tragic 13.1% |
| Salvadorans | 2.7 /100 | #232 | Tragic 13.2% |
| Cherokee | 2.5 /100 | #233 | Tragic 13.2% |
| Comanche | 2.4 /100 | #234 | Tragic 13.3% |
| Immigrants | Zaire | 1.9 /100 | #235 | Tragic 13.4% |
| Crow | 1.6 /100 | #236 | Tragic 13.4% |