Pakistani vs Immigrants from Afghanistan Receiving Food Stamps
COMPARE
Pakistani
Immigrants from Afghanistan
Receiving Food Stamps
Receiving Food Stamps Comparison
Pakistanis
Immigrants from Afghanistan
10.4%
RECEIVING FOOD STAMPS
95.9/ 100
METRIC RATING
110th/ 347
METRIC RANK
11.3%
RECEIVING FOOD STAMPS
75.6/ 100
METRIC RATING
156th/ 347
METRIC RANK
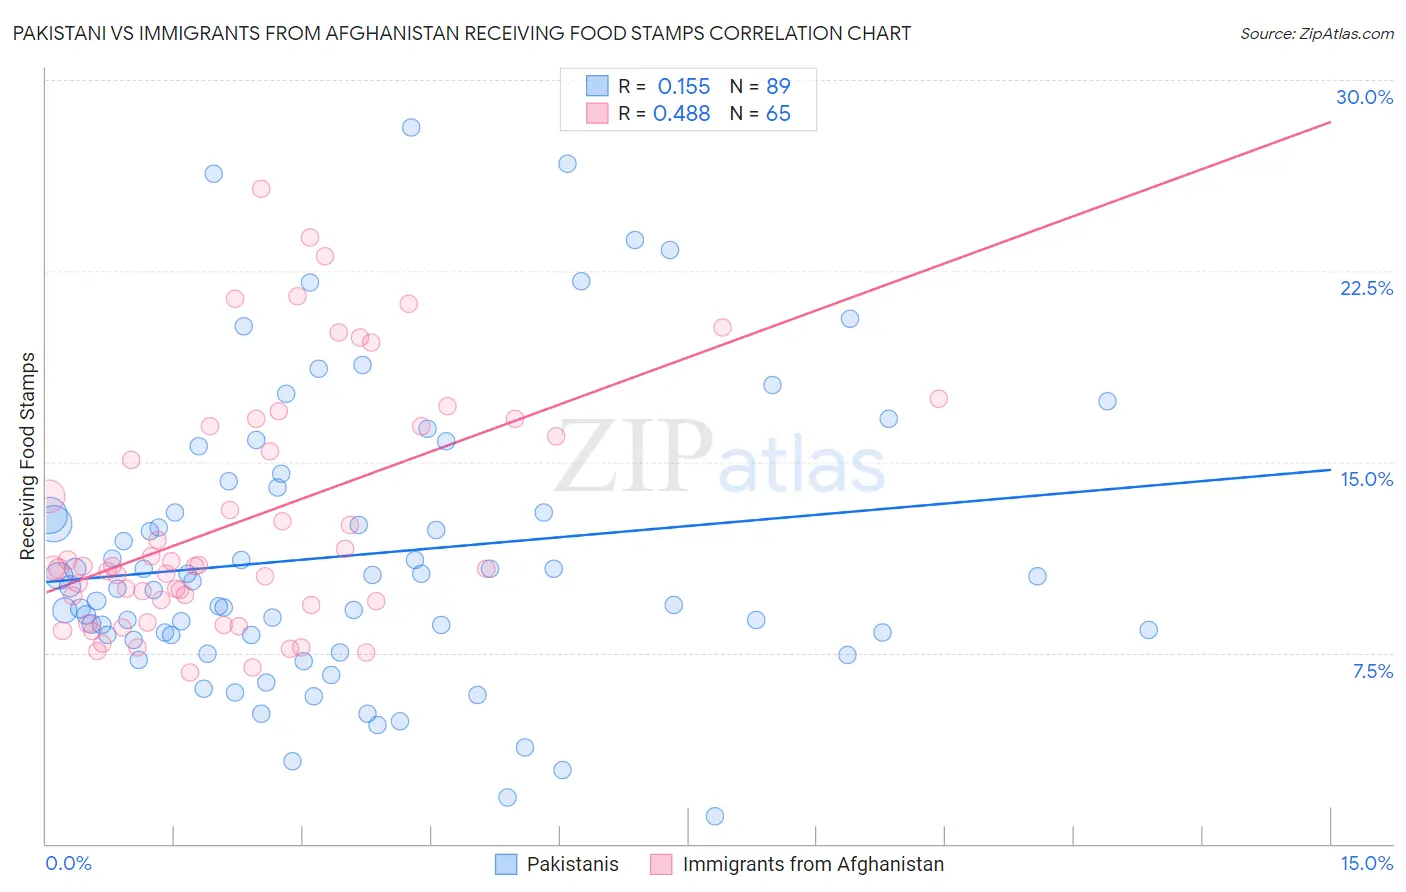
Pakistani vs Immigrants from Afghanistan Receiving Food Stamps Correlation Chart
The statistical analysis conducted on geographies consisting of 334,714,196 people shows a poor positive correlation between the proportion of Pakistanis and percentage of population receiving government assistance and/or food stamps in the United States with a correlation coefficient (R) of 0.155 and weighted average of 10.4%. Similarly, the statistical analysis conducted on geographies consisting of 147,557,843 people shows a moderate positive correlation between the proportion of Immigrants from Afghanistan and percentage of population receiving government assistance and/or food stamps in the United States with a correlation coefficient (R) of 0.488 and weighted average of 11.3%, a difference of 8.0%.
Receiving Food Stamps Correlation Summary
| Measurement | Pakistani | Immigrants from Afghanistan |
| Minimum | 1.1% | 6.7% |
| Maximum | 28.2% | 25.7% |
| Range | 27.1% | 19.0% |
| Mean | 11.3% | 12.7% |
| Median | 10.1% | 10.9% |
| Interquartile 25% (IQ1) | 8.2% | 9.5% |
| Interquartile 75% (IQ3) | 13.5% | 16.4% |
| Interquartile Range (IQR) | 5.3% | 6.9% |
| Standard Deviation (Sample) | 5.6% | 4.8% |
| Standard Deviation (Population) | 5.6% | 4.7% |
Similar Demographics by Receiving Food Stamps
Demographics Similar to Pakistanis by Receiving Food Stamps
In terms of receiving food stamps, the demographic groups most similar to Pakistanis are Romanian (10.4%, a difference of 0.10%), Mongolian (10.5%, a difference of 0.11%), Immigrants from Pakistan (10.4%, a difference of 0.28%), Carpatho Rusyn (10.4%, a difference of 0.33%), and Korean (10.4%, a difference of 0.36%).
| Demographics | Rating | Rank | Receiving Food Stamps |
| Immigrants | Latvia | 96.8 /100 | #103 | Exceptional 10.3% |
| Immigrants | Hungary | 96.7 /100 | #104 | Exceptional 10.3% |
| Immigrants | Malaysia | 96.5 /100 | #105 | Exceptional 10.4% |
| Immigrants | Italy | 96.4 /100 | #106 | Exceptional 10.4% |
| Koreans | 96.3 /100 | #107 | Exceptional 10.4% |
| Carpatho Rusyns | 96.2 /100 | #108 | Exceptional 10.4% |
| Immigrants | Pakistan | 96.2 /100 | #109 | Exceptional 10.4% |
| Pakistanis | 95.9 /100 | #110 | Exceptional 10.4% |
| Romanians | 95.8 /100 | #111 | Exceptional 10.4% |
| Mongolians | 95.8 /100 | #112 | Exceptional 10.5% |
| Icelanders | 95.4 /100 | #113 | Exceptional 10.5% |
| Scotch-Irish | 95.1 /100 | #114 | Exceptional 10.5% |
| Immigrants | Saudi Arabia | 94.9 /100 | #115 | Exceptional 10.5% |
| Canadians | 94.8 /100 | #116 | Exceptional 10.5% |
| Immigrants | Nepal | 94.6 /100 | #117 | Exceptional 10.6% |
Demographics Similar to Immigrants from Afghanistan by Receiving Food Stamps
In terms of receiving food stamps, the demographic groups most similar to Immigrants from Afghanistan are Immigrants from Lebanon (11.3%, a difference of 0.080%), Immigrants from Bosnia and Herzegovina (11.3%, a difference of 0.56%), Immigrants from Oceania (11.4%, a difference of 0.95%), Immigrants from Argentina (11.2%, a difference of 1.0%), and French Canadian (11.4%, a difference of 1.1%).
| Demographics | Rating | Rank | Receiving Food Stamps |
| Brazilians | 83.2 /100 | #149 | Excellent 11.1% |
| Soviet Union | 83.1 /100 | #150 | Excellent 11.1% |
| Immigrants | Spain | 81.7 /100 | #151 | Excellent 11.1% |
| Immigrants | Kazakhstan | 81.7 /100 | #152 | Excellent 11.1% |
| Lebanese | 81.6 /100 | #153 | Excellent 11.1% |
| Armenians | 81.4 /100 | #154 | Excellent 11.1% |
| Immigrants | Argentina | 80.4 /100 | #155 | Excellent 11.2% |
| Immigrants | Afghanistan | 75.6 /100 | #156 | Good 11.3% |
| Immigrants | Lebanon | 75.2 /100 | #157 | Good 11.3% |
| Immigrants | Bosnia and Herzegovina | 72.6 /100 | #158 | Good 11.3% |
| Immigrants | Oceania | 70.4 /100 | #159 | Good 11.4% |
| French Canadians | 69.5 /100 | #160 | Good 11.4% |
| Pennsylvania Germans | 68.4 /100 | #161 | Good 11.4% |
| Alsatians | 68.0 /100 | #162 | Good 11.4% |
| Immigrants | Southern Europe | 65.8 /100 | #163 | Good 11.5% |