Immigrants from Bangladesh vs Ottawa Receiving Food Stamps
COMPARE
Immigrants from Bangladesh
Ottawa
Receiving Food Stamps
Receiving Food Stamps Comparison
Immigrants from Bangladesh
Ottawa
15.9%
RECEIVING FOOD STAMPS
0.0/ 100
METRIC RATING
300th/ 347
METRIC RANK
13.1%
RECEIVING FOOD STAMPS
3.5/ 100
METRIC RATING
229th/ 347
METRIC RANK
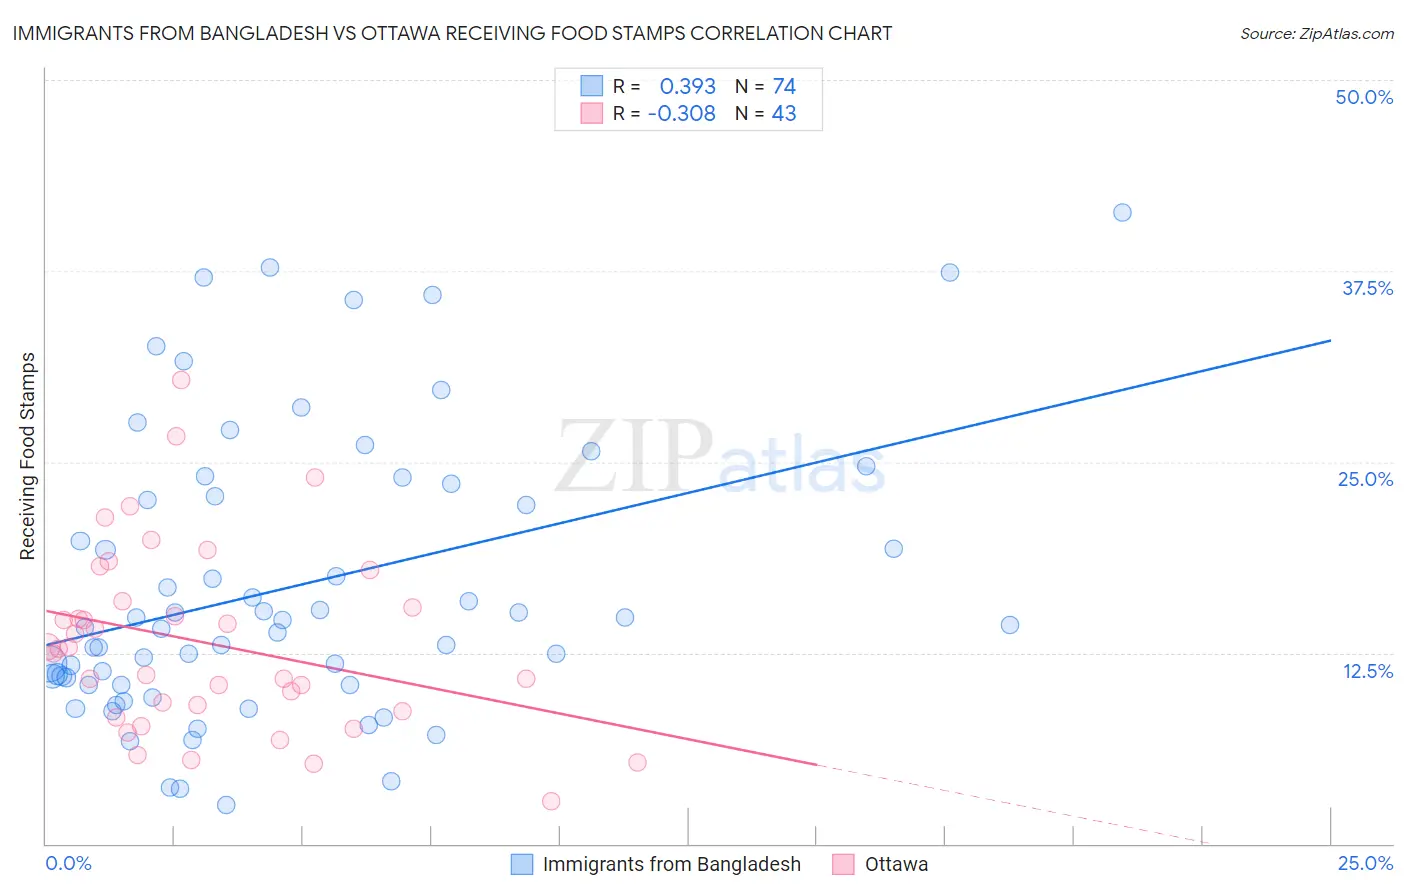
Immigrants from Bangladesh vs Ottawa Receiving Food Stamps Correlation Chart
The statistical analysis conducted on geographies consisting of 203,302,567 people shows a mild positive correlation between the proportion of Immigrants from Bangladesh and percentage of population receiving government assistance and/or food stamps in the United States with a correlation coefficient (R) of 0.393 and weighted average of 15.9%. Similarly, the statistical analysis conducted on geographies consisting of 49,940,459 people shows a mild negative correlation between the proportion of Ottawa and percentage of population receiving government assistance and/or food stamps in the United States with a correlation coefficient (R) of -0.308 and weighted average of 13.1%, a difference of 21.4%.
Receiving Food Stamps Correlation Summary
| Measurement | Immigrants from Bangladesh | Ottawa |
| Minimum | 2.5% | 2.8% |
| Maximum | 41.3% | 30.4% |
| Range | 38.8% | 27.6% |
| Mean | 16.8% | 13.1% |
| Median | 14.2% | 12.8% |
| Interquartile 25% (IQ1) | 10.4% | 8.7% |
| Interquartile 75% (IQ3) | 22.7% | 15.9% |
| Interquartile Range (IQR) | 12.3% | 7.2% |
| Standard Deviation (Sample) | 9.2% | 6.0% |
| Standard Deviation (Population) | 9.2% | 6.0% |
Similar Demographics by Receiving Food Stamps
Demographics Similar to Immigrants from Bangladesh by Receiving Food Stamps
In terms of receiving food stamps, the demographic groups most similar to Immigrants from Bangladesh are Hispanic or Latino (15.8%, a difference of 0.43%), Trinidadian and Tobagonian (16.0%, a difference of 0.45%), Immigrants from Trinidad and Tobago (15.8%, a difference of 0.71%), Immigrants from Bahamas (15.8%, a difference of 0.96%), and Tsimshian (15.7%, a difference of 1.1%).
| Demographics | Rating | Rank | Receiving Food Stamps |
| Vietnamese | 0.0 /100 | #293 | Tragic 15.7% |
| Immigrants | Latin America | 0.0 /100 | #294 | Tragic 15.7% |
| Immigrants | Honduras | 0.0 /100 | #295 | Tragic 15.7% |
| Tsimshian | 0.0 /100 | #296 | Tragic 15.7% |
| Immigrants | Bahamas | 0.0 /100 | #297 | Tragic 15.8% |
| Immigrants | Trinidad and Tobago | 0.0 /100 | #298 | Tragic 15.8% |
| Hispanics or Latinos | 0.0 /100 | #299 | Tragic 15.8% |
| Immigrants | Bangladesh | 0.0 /100 | #300 | Tragic 15.9% |
| Trinidadians and Tobagonians | 0.0 /100 | #301 | Tragic 16.0% |
| Immigrants | West Indies | 0.0 /100 | #302 | Tragic 16.1% |
| Nicaraguans | 0.0 /100 | #303 | Tragic 16.1% |
| West Indians | 0.0 /100 | #304 | Tragic 16.3% |
| Immigrants | Azores | 0.0 /100 | #305 | Tragic 16.4% |
| Jamaicans | 0.0 /100 | #306 | Tragic 16.4% |
| Houma | 0.0 /100 | #307 | Tragic 16.5% |
Demographics Similar to Ottawa by Receiving Food Stamps
In terms of receiving food stamps, the demographic groups most similar to Ottawa are Panamanian (13.1%, a difference of 0.010%), Nigerian (13.1%, a difference of 0.020%), Puget Sound Salish (13.1%, a difference of 0.050%), Chickasaw (13.1%, a difference of 0.070%), and Immigrants from Nigeria (13.1%, a difference of 0.090%).
| Demographics | Rating | Rank | Receiving Food Stamps |
| Immigrants | Immigrants | 4.4 /100 | #222 | Tragic 13.0% |
| Immigrants | Albania | 4.4 /100 | #223 | Tragic 13.0% |
| Immigrants | Armenia | 4.3 /100 | #224 | Tragic 13.0% |
| Fijians | 4.3 /100 | #225 | Tragic 13.0% |
| Chickasaw | 3.6 /100 | #226 | Tragic 13.1% |
| Nigerians | 3.5 /100 | #227 | Tragic 13.1% |
| Panamanians | 3.5 /100 | #228 | Tragic 13.1% |
| Ottawa | 3.5 /100 | #229 | Tragic 13.1% |
| Puget Sound Salish | 3.4 /100 | #230 | Tragic 13.1% |
| Immigrants | Nigeria | 3.4 /100 | #231 | Tragic 13.1% |
| Salvadorans | 2.7 /100 | #232 | Tragic 13.2% |
| Cherokee | 2.5 /100 | #233 | Tragic 13.2% |
| Comanche | 2.4 /100 | #234 | Tragic 13.3% |
| Immigrants | Zaire | 1.9 /100 | #235 | Tragic 13.4% |
| Crow | 1.6 /100 | #236 | Tragic 13.4% |