Pakistani vs Immigrants from the Azores Receiving Food Stamps
COMPARE
Pakistani
Immigrants from the Azores
Receiving Food Stamps
Receiving Food Stamps Comparison
Pakistanis
Immigrants from the Azores
10.4%
RECEIVING FOOD STAMPS
95.9/ 100
METRIC RATING
110th/ 347
METRIC RANK
16.4%
RECEIVING FOOD STAMPS
0.0/ 100
METRIC RATING
305th/ 347
METRIC RANK
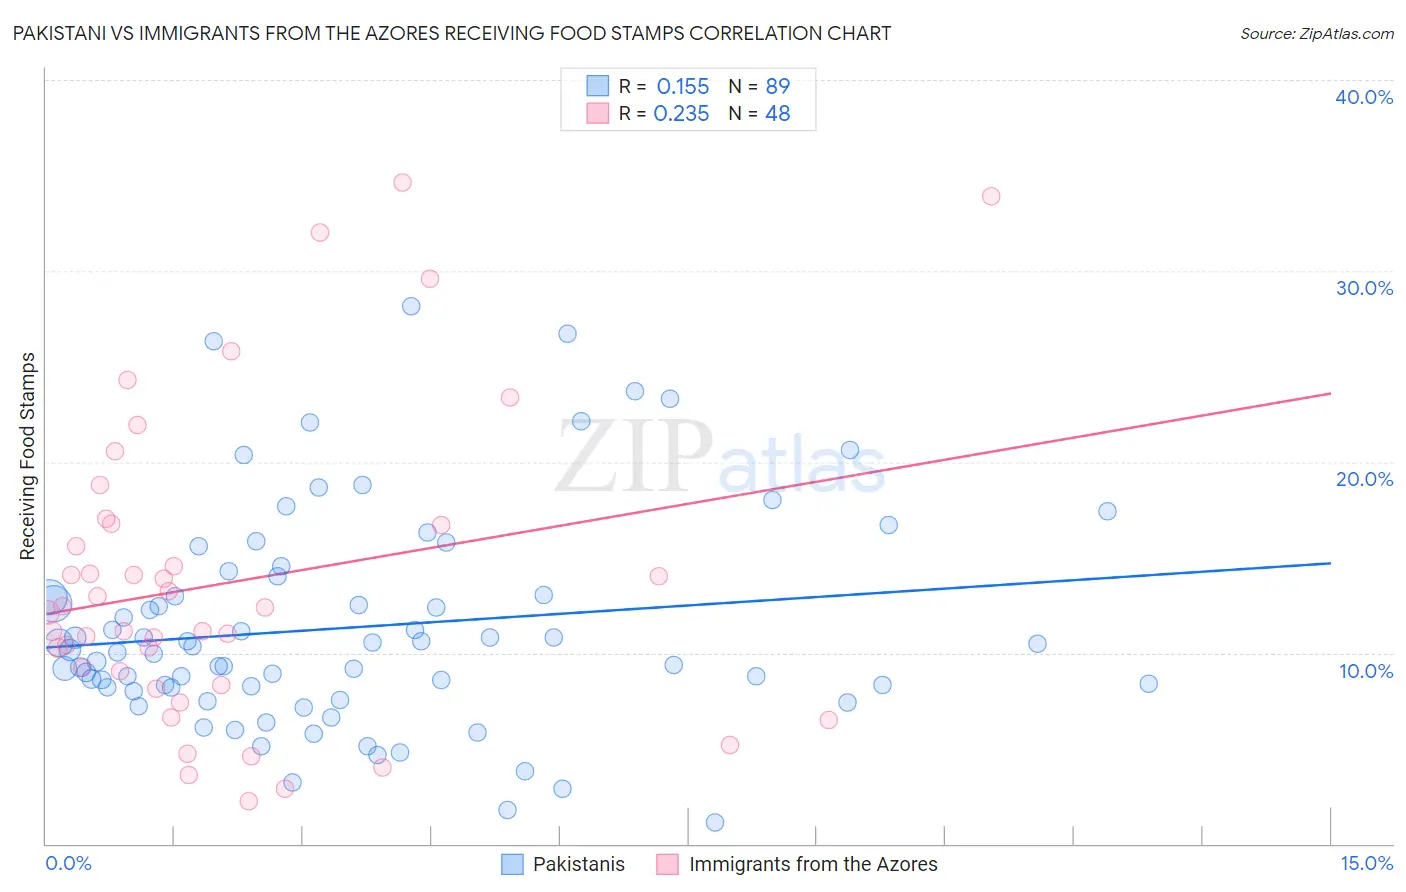
Pakistani vs Immigrants from the Azores Receiving Food Stamps Correlation Chart
The statistical analysis conducted on geographies consisting of 334,714,196 people shows a poor positive correlation between the proportion of Pakistanis and percentage of population receiving government assistance and/or food stamps in the United States with a correlation coefficient (R) of 0.155 and weighted average of 10.4%. Similarly, the statistical analysis conducted on geographies consisting of 46,243,454 people shows a weak positive correlation between the proportion of Immigrants from the Azores and percentage of population receiving government assistance and/or food stamps in the United States with a correlation coefficient (R) of 0.235 and weighted average of 16.4%, a difference of 57.0%.
Receiving Food Stamps Correlation Summary
| Measurement | Pakistani | Immigrants from the Azores |
| Minimum | 1.1% | 2.2% |
| Maximum | 28.2% | 34.6% |
| Range | 27.1% | 32.4% |
| Mean | 11.3% | 13.7% |
| Median | 10.1% | 12.3% |
| Interquartile 25% (IQ1) | 8.2% | 8.7% |
| Interquartile 75% (IQ3) | 13.5% | 16.7% |
| Interquartile Range (IQR) | 5.3% | 8.1% |
| Standard Deviation (Sample) | 5.6% | 7.9% |
| Standard Deviation (Population) | 5.6% | 7.9% |
Similar Demographics by Receiving Food Stamps
Demographics Similar to Pakistanis by Receiving Food Stamps
In terms of receiving food stamps, the demographic groups most similar to Pakistanis are Romanian (10.4%, a difference of 0.10%), Mongolian (10.5%, a difference of 0.11%), Immigrants from Pakistan (10.4%, a difference of 0.28%), Carpatho Rusyn (10.4%, a difference of 0.33%), and Korean (10.4%, a difference of 0.36%).
| Demographics | Rating | Rank | Receiving Food Stamps |
| Immigrants | Latvia | 96.8 /100 | #103 | Exceptional 10.3% |
| Immigrants | Hungary | 96.7 /100 | #104 | Exceptional 10.3% |
| Immigrants | Malaysia | 96.5 /100 | #105 | Exceptional 10.4% |
| Immigrants | Italy | 96.4 /100 | #106 | Exceptional 10.4% |
| Koreans | 96.3 /100 | #107 | Exceptional 10.4% |
| Carpatho Rusyns | 96.2 /100 | #108 | Exceptional 10.4% |
| Immigrants | Pakistan | 96.2 /100 | #109 | Exceptional 10.4% |
| Pakistanis | 95.9 /100 | #110 | Exceptional 10.4% |
| Romanians | 95.8 /100 | #111 | Exceptional 10.4% |
| Mongolians | 95.8 /100 | #112 | Exceptional 10.5% |
| Icelanders | 95.4 /100 | #113 | Exceptional 10.5% |
| Scotch-Irish | 95.1 /100 | #114 | Exceptional 10.5% |
| Immigrants | Saudi Arabia | 94.9 /100 | #115 | Exceptional 10.5% |
| Canadians | 94.8 /100 | #116 | Exceptional 10.5% |
| Immigrants | Nepal | 94.6 /100 | #117 | Exceptional 10.6% |
Demographics Similar to Immigrants from the Azores by Receiving Food Stamps
In terms of receiving food stamps, the demographic groups most similar to Immigrants from the Azores are Jamaican (16.4%, a difference of 0.070%), Houma (16.5%, a difference of 0.35%), Barbadian (16.5%, a difference of 0.62%), U.S. Virgin Islander (16.5%, a difference of 0.86%), and West Indian (16.3%, a difference of 0.88%).
| Demographics | Rating | Rank | Receiving Food Stamps |
| Immigrants | Trinidad and Tobago | 0.0 /100 | #298 | Tragic 15.8% |
| Hispanics or Latinos | 0.0 /100 | #299 | Tragic 15.8% |
| Immigrants | Bangladesh | 0.0 /100 | #300 | Tragic 15.9% |
| Trinidadians and Tobagonians | 0.0 /100 | #301 | Tragic 16.0% |
| Immigrants | West Indies | 0.0 /100 | #302 | Tragic 16.1% |
| Nicaraguans | 0.0 /100 | #303 | Tragic 16.1% |
| West Indians | 0.0 /100 | #304 | Tragic 16.3% |
| Immigrants | Azores | 0.0 /100 | #305 | Tragic 16.4% |
| Jamaicans | 0.0 /100 | #306 | Tragic 16.4% |
| Houma | 0.0 /100 | #307 | Tragic 16.5% |
| Barbadians | 0.0 /100 | #308 | Tragic 16.5% |
| U.S. Virgin Islanders | 0.0 /100 | #309 | Tragic 16.5% |
| Immigrants | Barbados | 0.0 /100 | #310 | Tragic 16.6% |
| Guyanese | 0.0 /100 | #311 | Tragic 16.7% |
| Sioux | 0.0 /100 | #312 | Tragic 16.8% |