Immigrants from Uruguay vs Ghanaian Child Poverty Among Girls Under 16
COMPARE
Immigrants from Uruguay
Ghanaian
Child Poverty Among Girls Under 16
Child Poverty Among Girls Under 16 Comparison
Immigrants from Uruguay
Ghanaians
16.7%
CHILD POVERTY AMONG GIRLS UNDER 16
35.6/ 100
METRIC RATING
185th/ 347
METRIC RANK
18.5%
CHILD POVERTY AMONG GIRLS UNDER 16
1.4/ 100
METRIC RATING
229th/ 347
METRIC RANK
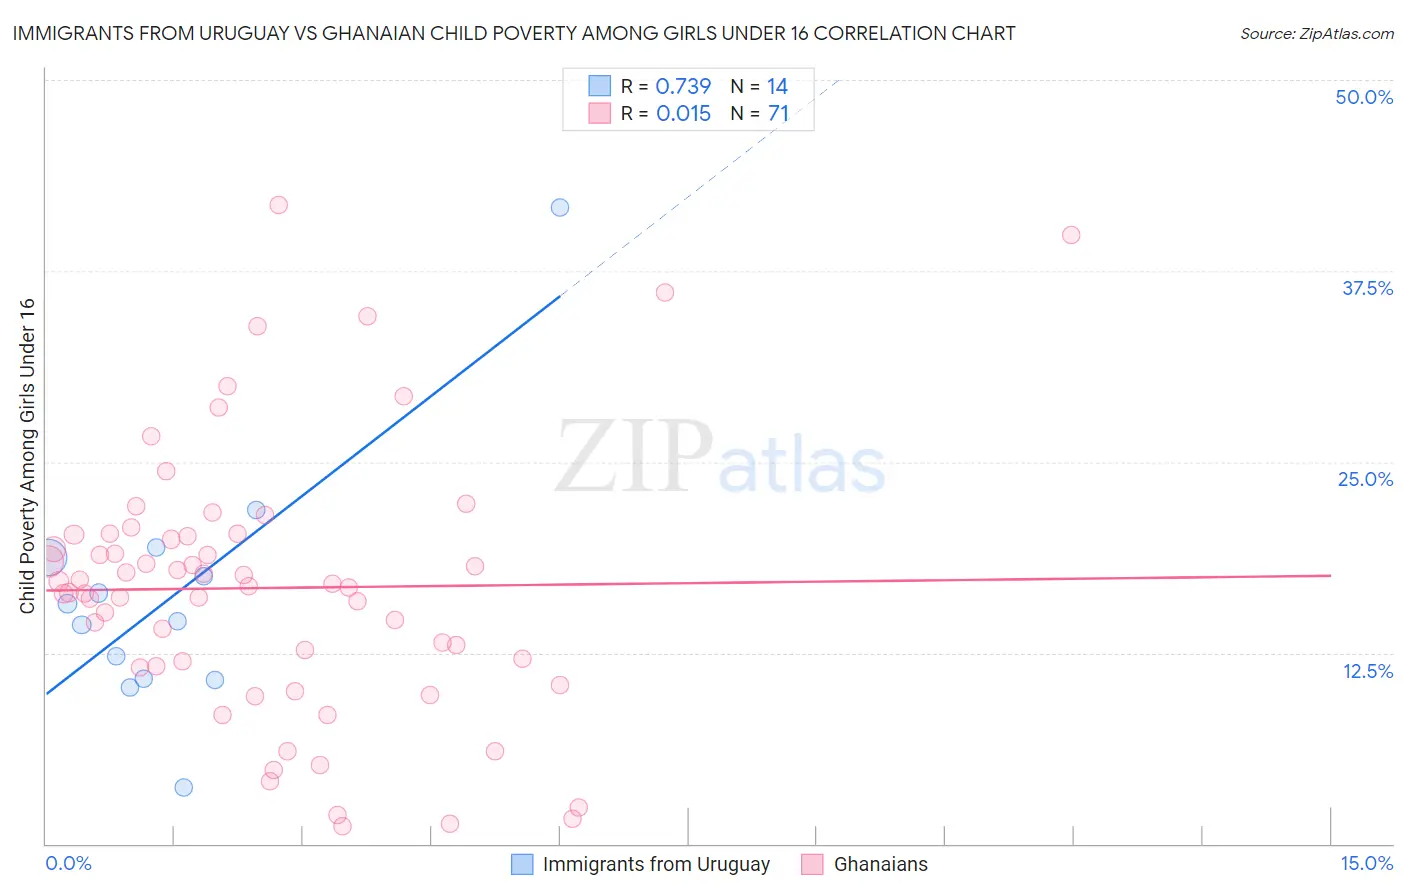
Immigrants from Uruguay vs Ghanaian Child Poverty Among Girls Under 16 Correlation Chart
The statistical analysis conducted on geographies consisting of 132,453,644 people shows a strong positive correlation between the proportion of Immigrants from Uruguay and poverty level among girls under the age of 16 in the United States with a correlation coefficient (R) of 0.739 and weighted average of 16.7%. Similarly, the statistical analysis conducted on geographies consisting of 189,052,408 people shows no correlation between the proportion of Ghanaians and poverty level among girls under the age of 16 in the United States with a correlation coefficient (R) of 0.015 and weighted average of 18.5%, a difference of 10.4%.
Child Poverty Among Girls Under 16 Correlation Summary
| Measurement | Immigrants from Uruguay | Ghanaian |
| Minimum | 3.7% | 1.1% |
| Maximum | 41.7% | 41.8% |
| Range | 38.0% | 40.7% |
| Mean | 16.3% | 16.7% |
| Median | 15.2% | 16.8% |
| Interquartile 25% (IQ1) | 10.8% | 11.7% |
| Interquartile 75% (IQ3) | 18.8% | 20.2% |
| Interquartile Range (IQR) | 7.9% | 8.6% |
| Standard Deviation (Sample) | 8.6% | 8.7% |
| Standard Deviation (Population) | 8.3% | 8.6% |
Similar Demographics by Child Poverty Among Girls Under 16
Demographics Similar to Immigrants from Uruguay by Child Poverty Among Girls Under 16
In terms of child poverty among girls under 16, the demographic groups most similar to Immigrants from Uruguay are South American Indian (16.8%, a difference of 0.070%), Immigrants from Morocco (16.8%, a difference of 0.13%), Arab (16.8%, a difference of 0.13%), Immigrants from Bosnia and Herzegovina (16.8%, a difference of 0.38%), and Kenyan (16.8%, a difference of 0.42%).
| Demographics | Rating | Rank | Child Poverty Among Girls Under 16 |
| Whites/Caucasians | 43.6 /100 | #178 | Average 16.6% |
| Hawaiians | 43.4 /100 | #179 | Average 16.6% |
| Immigrants | Syria | 43.3 /100 | #180 | Average 16.6% |
| Immigrants | Iraq | 43.2 /100 | #181 | Average 16.6% |
| Immigrants | Ethiopia | 43.1 /100 | #182 | Average 16.6% |
| Immigrants | Portugal | 42.5 /100 | #183 | Average 16.6% |
| Scotch-Irish | 39.6 /100 | #184 | Fair 16.7% |
| Immigrants | Uruguay | 35.6 /100 | #185 | Fair 16.7% |
| South American Indians | 35.0 /100 | #186 | Fair 16.8% |
| Immigrants | Morocco | 34.6 /100 | #187 | Fair 16.8% |
| Arabs | 34.5 /100 | #188 | Fair 16.8% |
| Immigrants | Bosnia and Herzegovina | 32.5 /100 | #189 | Fair 16.8% |
| Kenyans | 32.3 /100 | #190 | Fair 16.8% |
| Immigrants | Azores | 31.3 /100 | #191 | Fair 16.8% |
| Immigrants | Uganda | 31.3 /100 | #192 | Fair 16.8% |
Demographics Similar to Ghanaians by Child Poverty Among Girls Under 16
In terms of child poverty among girls under 16, the demographic groups most similar to Ghanaians are Osage (18.5%, a difference of 0.19%), Cree (18.5%, a difference of 0.27%), Immigrants from Sudan (18.6%, a difference of 0.52%), Sudanese (18.6%, a difference of 0.56%), and Fijian (18.6%, a difference of 0.63%).
| Demographics | Rating | Rank | Child Poverty Among Girls Under 16 |
| Immigrants | Cambodia | 2.9 /100 | #222 | Tragic 18.1% |
| Immigrants | Armenia | 2.9 /100 | #223 | Tragic 18.1% |
| Bermudans | 2.8 /100 | #224 | Tragic 18.1% |
| Immigrants | Africa | 2.7 /100 | #225 | Tragic 18.2% |
| Nicaraguans | 2.4 /100 | #226 | Tragic 18.2% |
| Immigrants | Nonimmigrants | 2.0 /100 | #227 | Tragic 18.3% |
| Alaskan Athabascans | 2.0 /100 | #228 | Tragic 18.3% |
| Ghanaians | 1.4 /100 | #229 | Tragic 18.5% |
| Osage | 1.3 /100 | #230 | Tragic 18.5% |
| Cree | 1.3 /100 | #231 | Tragic 18.5% |
| Immigrants | Sudan | 1.1 /100 | #232 | Tragic 18.6% |
| Sudanese | 1.1 /100 | #233 | Tragic 18.6% |
| Fijians | 1.1 /100 | #234 | Tragic 18.6% |
| Nepalese | 1.1 /100 | #235 | Tragic 18.6% |
| Alsatians | 1.1 /100 | #236 | Tragic 18.6% |