Immigrants vs Ghanaian Child Poverty Among Girls Under 16
COMPARE
Immigrants
Ghanaian
Child Poverty Among Girls Under 16
Child Poverty Among Girls Under 16 Comparison
Immigrants
Ghanaians
17.7%
CHILD POVERTY AMONG GIRLS UNDER 16
7.3/ 100
METRIC RATING
210th/ 347
METRIC RANK
18.5%
CHILD POVERTY AMONG GIRLS UNDER 16
1.4/ 100
METRIC RATING
229th/ 347
METRIC RANK
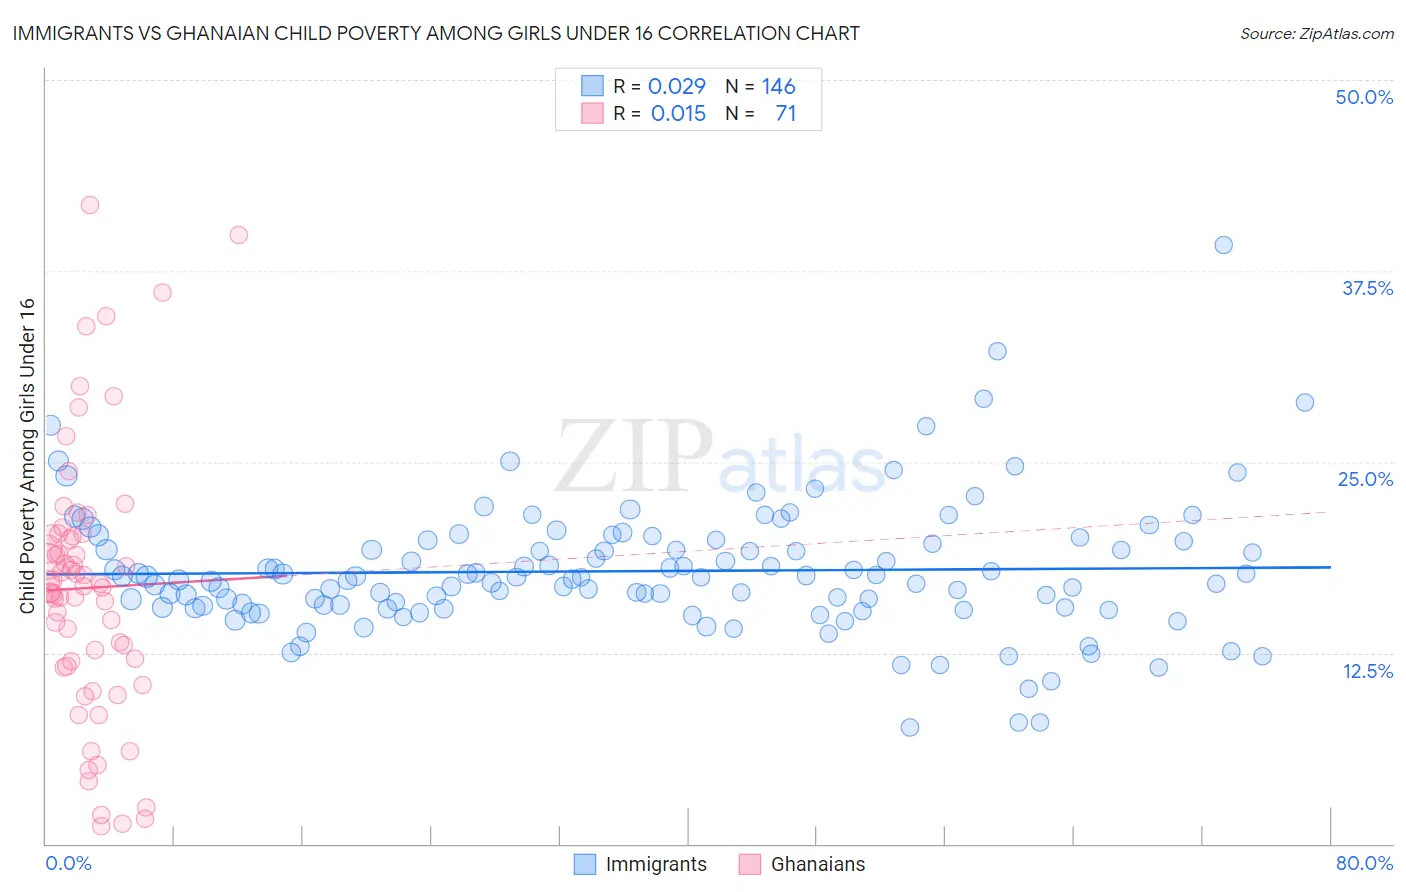
Immigrants vs Ghanaian Child Poverty Among Girls Under 16 Correlation Chart
The statistical analysis conducted on geographies consisting of 554,633,406 people shows no correlation between the proportion of Immigrants and poverty level among girls under the age of 16 in the United States with a correlation coefficient (R) of 0.029 and weighted average of 17.7%. Similarly, the statistical analysis conducted on geographies consisting of 189,052,408 people shows no correlation between the proportion of Ghanaians and poverty level among girls under the age of 16 in the United States with a correlation coefficient (R) of 0.015 and weighted average of 18.5%, a difference of 4.6%.
Child Poverty Among Girls Under 16 Correlation Summary
| Measurement | Immigrants | Ghanaian |
| Minimum | 7.6% | 1.1% |
| Maximum | 39.2% | 41.8% |
| Range | 31.6% | 40.7% |
| Mean | 17.8% | 16.7% |
| Median | 17.4% | 16.8% |
| Interquartile 25% (IQ1) | 15.5% | 11.7% |
| Interquartile 75% (IQ3) | 19.8% | 20.2% |
| Interquartile Range (IQR) | 4.3% | 8.6% |
| Standard Deviation (Sample) | 4.3% | 8.7% |
| Standard Deviation (Population) | 4.3% | 8.6% |
Demographics Similar to Immigrants and Ghanaians by Child Poverty Among Girls Under 16
In terms of child poverty among girls under 16, the demographic groups most similar to Immigrants are Immigrants from Eastern Africa (17.7%, a difference of 0.39%), Immigrants from Thailand (17.7%, a difference of 0.44%), Panamanian (17.6%, a difference of 0.51%), Pennsylvania German (17.8%, a difference of 0.70%), and Malaysian (17.8%, a difference of 0.72%). Similarly, the demographic groups most similar to Ghanaians are Alaskan Athabascan (18.3%, a difference of 0.91%), Nonimmigrants (18.3%, a difference of 0.95%), Nicaraguan (18.2%, a difference of 1.5%), Immigrants from Africa (18.2%, a difference of 1.8%), and Bermudan (18.1%, a difference of 1.9%).
| Demographics | Rating | Rank | Child Poverty Among Girls Under 16 |
| Panamanians | 8.7 /100 | #209 | Tragic 17.6% |
| Immigrants | Immigrants | 7.3 /100 | #210 | Tragic 17.7% |
| Immigrants | Eastern Africa | 6.4 /100 | #211 | Tragic 17.7% |
| Immigrants | Thailand | 6.3 /100 | #212 | Tragic 17.7% |
| Pennsylvania Germans | 5.7 /100 | #213 | Tragic 17.8% |
| Malaysians | 5.7 /100 | #214 | Tragic 17.8% |
| German Russians | 5.7 /100 | #215 | Tragic 17.8% |
| Moroccans | 5.5 /100 | #216 | Tragic 17.8% |
| Japanese | 5.3 /100 | #217 | Tragic 17.8% |
| Alaska Natives | 5.2 /100 | #218 | Tragic 17.8% |
| Immigrants | Panama | 4.7 /100 | #219 | Tragic 17.9% |
| Cubans | 4.1 /100 | #220 | Tragic 18.0% |
| Immigrants | Micronesia | 3.5 /100 | #221 | Tragic 18.0% |
| Immigrants | Cambodia | 2.9 /100 | #222 | Tragic 18.1% |
| Immigrants | Armenia | 2.9 /100 | #223 | Tragic 18.1% |
| Bermudans | 2.8 /100 | #224 | Tragic 18.1% |
| Immigrants | Africa | 2.7 /100 | #225 | Tragic 18.2% |
| Nicaraguans | 2.4 /100 | #226 | Tragic 18.2% |
| Immigrants | Nonimmigrants | 2.0 /100 | #227 | Tragic 18.3% |
| Alaskan Athabascans | 2.0 /100 | #228 | Tragic 18.3% |
| Ghanaians | 1.4 /100 | #229 | Tragic 18.5% |