Immigrants from Bulgaria vs Egyptian Single Male Poverty
COMPARE
Immigrants from Bulgaria
Egyptian
Single Male Poverty
Single Male Poverty Comparison
Immigrants from Bulgaria
Egyptians
11.6%
SINGLE MALE POVERTY
99.9/ 100
METRIC RATING
46th/ 347
METRIC RANK
11.5%
SINGLE MALE POVERTY
99.9/ 100
METRIC RATING
42nd/ 347
METRIC RANK
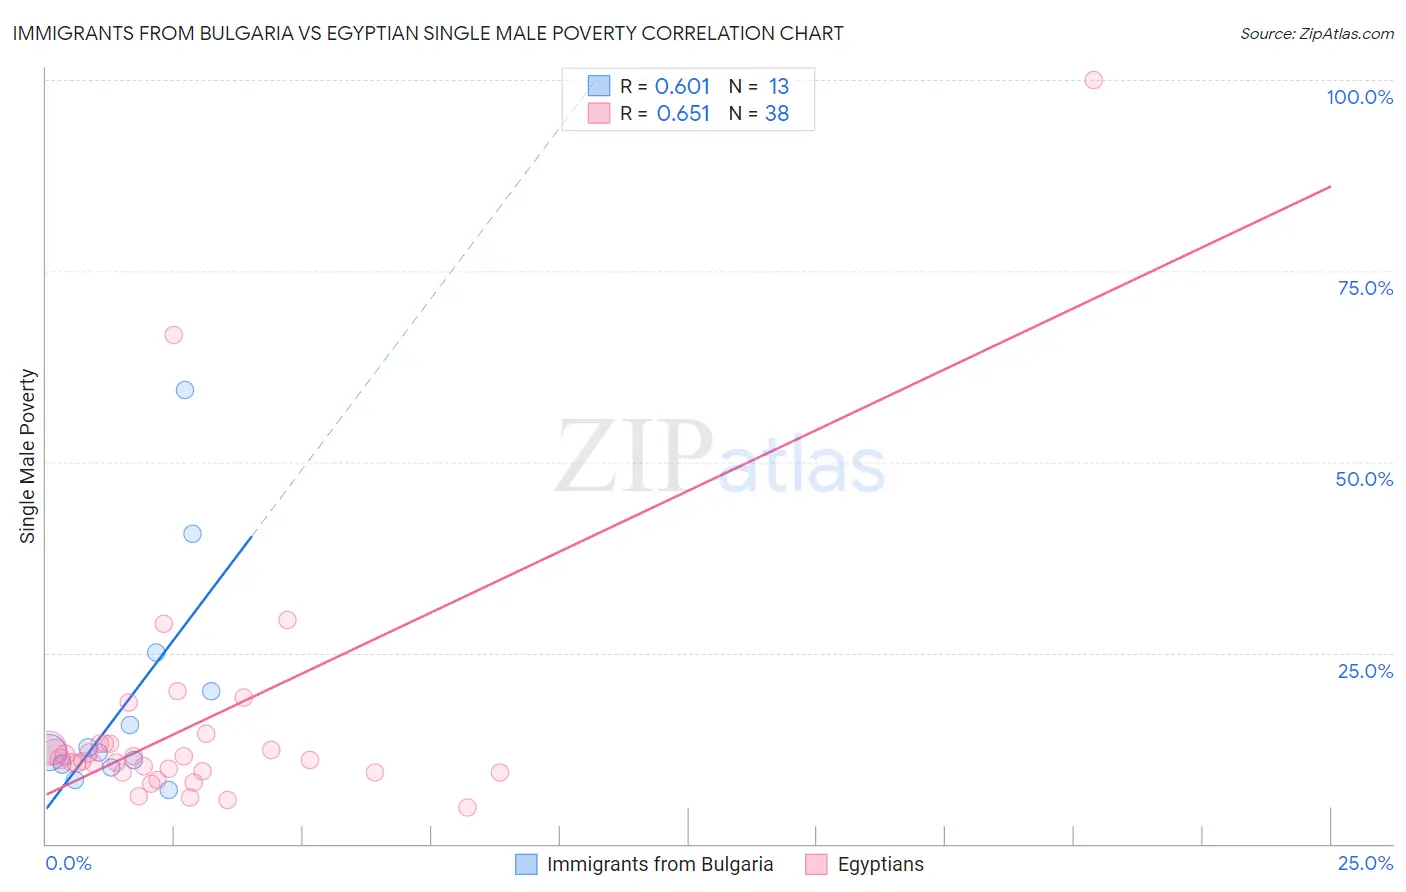
Immigrants from Bulgaria vs Egyptian Single Male Poverty Correlation Chart
The statistical analysis conducted on geographies consisting of 159,455,657 people shows a significant positive correlation between the proportion of Immigrants from Bulgaria and poverty level among single males in the United States with a correlation coefficient (R) of 0.601 and weighted average of 11.6%. Similarly, the statistical analysis conducted on geographies consisting of 251,299,113 people shows a significant positive correlation between the proportion of Egyptians and poverty level among single males in the United States with a correlation coefficient (R) of 0.651 and weighted average of 11.5%, a difference of 0.31%.
Single Male Poverty Correlation Summary
| Measurement | Immigrants from Bulgaria | Egyptian |
| Minimum | 7.0% | 4.7% |
| Maximum | 59.4% | 100.0% |
| Range | 52.3% | 95.3% |
| Mean | 18.7% | 15.8% |
| Median | 11.9% | 11.0% |
| Interquartile 25% (IQ1) | 10.3% | 9.4% |
| Interquartile 75% (IQ3) | 22.5% | 13.1% |
| Interquartile Range (IQR) | 12.2% | 3.8% |
| Standard Deviation (Sample) | 15.2% | 17.4% |
| Standard Deviation (Population) | 14.6% | 17.2% |
Demographics Similar to Immigrants from Bulgaria and Egyptians by Single Male Poverty
In terms of single male poverty, the demographic groups most similar to Immigrants from Bulgaria are Immigrants from Poland (11.5%, a difference of 0.13%), Immigrants from Cameroon (11.5%, a difference of 0.15%), Immigrants from Peru (11.5%, a difference of 0.16%), Nepalese (11.6%, a difference of 0.20%), and Immigrants from Indonesia (11.6%, a difference of 0.27%). Similarly, the demographic groups most similar to Egyptians are Immigrants from Iraq (11.5%, a difference of 0.050%), Immigrants from Peru (11.5%, a difference of 0.15%), Immigrants from Cameroon (11.5%, a difference of 0.17%), Immigrants from Poland (11.5%, a difference of 0.18%), and Immigrants from Korea (11.5%, a difference of 0.20%).
| Demographics | Rating | Rank | Single Male Poverty |
| Immigrants | Ethiopia | 100.0 /100 | #34 | Exceptional 11.4% |
| Immigrants | South Eastern Asia | 100.0 /100 | #35 | Exceptional 11.4% |
| Immigrants | Serbia | 100.0 /100 | #36 | Exceptional 11.4% |
| Immigrants | Singapore | 100.0 /100 | #37 | Exceptional 11.4% |
| Sri Lankans | 100.0 /100 | #38 | Exceptional 11.5% |
| Soviet Union | 100.0 /100 | #39 | Exceptional 11.5% |
| Immigrants | Korea | 100.0 /100 | #40 | Exceptional 11.5% |
| Immigrants | Iraq | 99.9 /100 | #41 | Exceptional 11.5% |
| Egyptians | 99.9 /100 | #42 | Exceptional 11.5% |
| Immigrants | Peru | 99.9 /100 | #43 | Exceptional 11.5% |
| Immigrants | Cameroon | 99.9 /100 | #44 | Exceptional 11.5% |
| Immigrants | Poland | 99.9 /100 | #45 | Exceptional 11.5% |
| Immigrants | Bulgaria | 99.9 /100 | #46 | Exceptional 11.6% |
| Nepalese | 99.9 /100 | #47 | Exceptional 11.6% |
| Immigrants | Indonesia | 99.9 /100 | #48 | Exceptional 11.6% |
| Tlingit-Haida | 99.9 /100 | #49 | Exceptional 11.6% |
| Immigrants | Lithuania | 99.9 /100 | #50 | Exceptional 11.6% |
| Paraguayans | 99.9 /100 | #51 | Exceptional 11.6% |
| Samoans | 99.9 /100 | #52 | Exceptional 11.7% |
| Bulgarians | 99.9 /100 | #53 | Exceptional 11.7% |
| Immigrants | Uzbekistan | 99.9 /100 | #54 | Exceptional 11.7% |