Delaware vs Iraqi Child Poverty Among Girls Under 16
COMPARE
Delaware
Iraqi
Child Poverty Among Girls Under 16
Child Poverty Among Girls Under 16 Comparison
Delaware
Iraqis
17.4%
CHILD POVERTY AMONG GIRLS UNDER 16
11.5/ 100
METRIC RATING
206th/ 347
METRIC RANK
17.4%
CHILD POVERTY AMONG GIRLS UNDER 16
13.0/ 100
METRIC RATING
204th/ 347
METRIC RANK
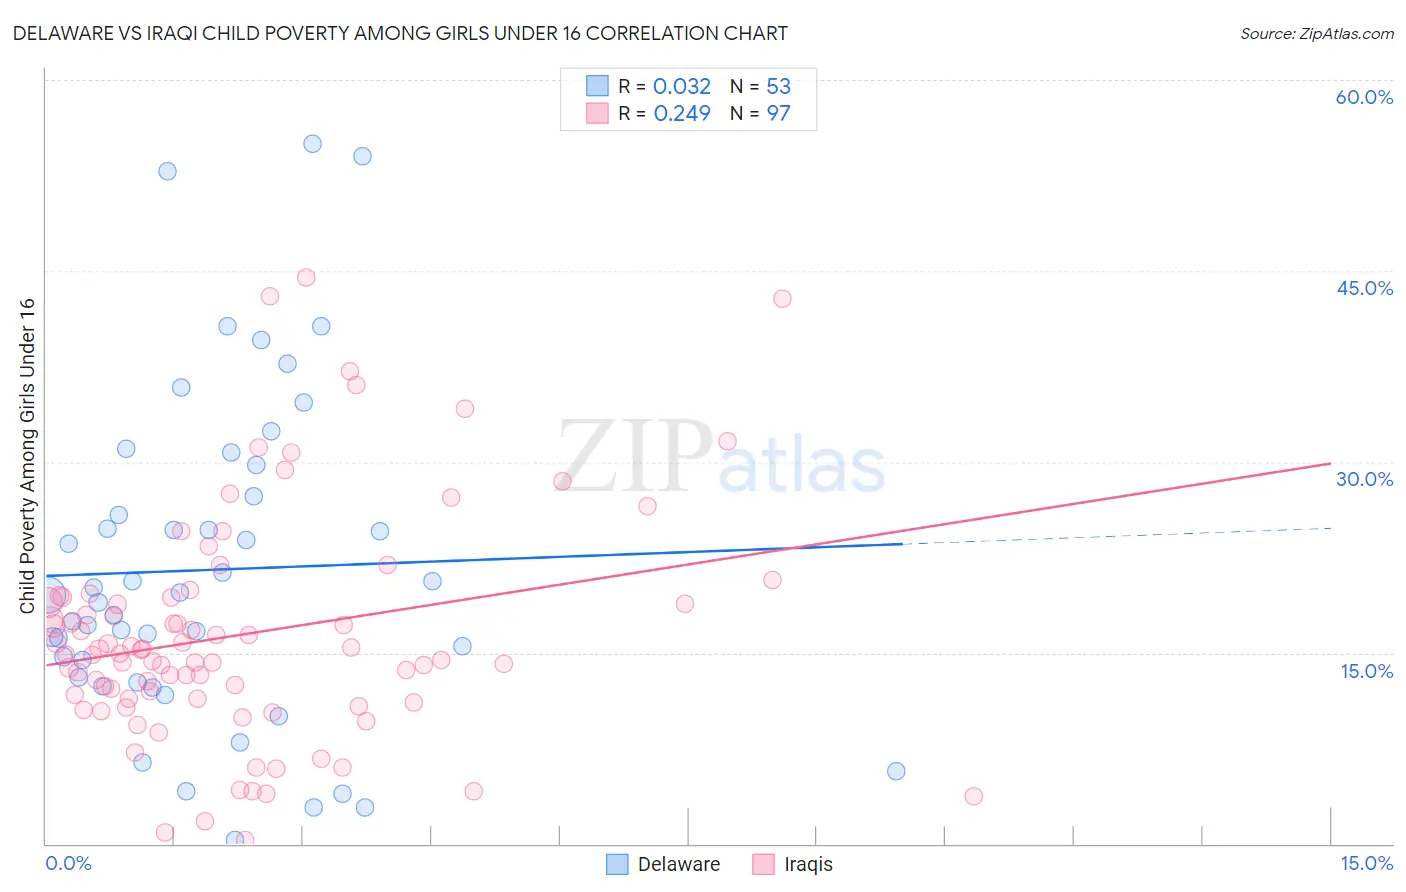
Delaware vs Iraqi Child Poverty Among Girls Under 16 Correlation Chart
The statistical analysis conducted on geographies consisting of 95,689,201 people shows no correlation between the proportion of Delaware and poverty level among girls under the age of 16 in the United States with a correlation coefficient (R) of 0.032 and weighted average of 17.4%. Similarly, the statistical analysis conducted on geographies consisting of 169,508,253 people shows a weak positive correlation between the proportion of Iraqis and poverty level among girls under the age of 16 in the United States with a correlation coefficient (R) of 0.249 and weighted average of 17.4%, a difference of 0.37%.
Child Poverty Among Girls Under 16 Correlation Summary
| Measurement | Delaware | Iraqi |
| Minimum | 0.32% | 0.32% |
| Maximum | 55.0% | 44.5% |
| Range | 54.7% | 44.2% |
| Mean | 21.5% | 16.5% |
| Median | 19.5% | 14.9% |
| Interquartile 25% (IQ1) | 12.8% | 11.4% |
| Interquartile 75% (IQ3) | 28.5% | 19.3% |
| Interquartile Range (IQR) | 15.7% | 8.0% |
| Standard Deviation (Sample) | 12.9% | 8.9% |
| Standard Deviation (Population) | 12.7% | 8.9% |
Demographics Similar to Delaware and Iraqis by Child Poverty Among Girls Under 16
In terms of child poverty among girls under 16, the demographic groups most similar to Delaware are Hmong (17.5%, a difference of 0.25%), Immigrants from Cameroon (17.4%, a difference of 0.27%), Sierra Leonean (17.6%, a difference of 0.78%), Panamanian (17.6%, a difference of 0.84%), and Ugandan (17.2%, a difference of 1.3%). Similarly, the demographic groups most similar to Iraqis are Immigrants from Cameroon (17.4%, a difference of 0.10%), Hmong (17.5%, a difference of 0.62%), Ugandan (17.2%, a difference of 0.97%), Immigrants from Sierra Leone (17.2%, a difference of 0.98%), and Immigrants from Kenya (17.2%, a difference of 1.0%).
| Demographics | Rating | Rank | Child Poverty Among Girls Under 16 |
| Immigrants | Costa Rica | 25.6 /100 | #195 | Fair 17.0% |
| Celtics | 25.2 /100 | #196 | Fair 17.0% |
| Spaniards | 24.9 /100 | #197 | Fair 17.0% |
| Immigrants | Lebanon | 22.6 /100 | #198 | Fair 17.1% |
| Immigrants | Afghanistan | 22.4 /100 | #199 | Fair 17.1% |
| Immigrants | Uzbekistan | 21.5 /100 | #200 | Fair 17.1% |
| Immigrants | Kenya | 17.8 /100 | #201 | Poor 17.2% |
| Immigrants | Sierra Leone | 17.6 /100 | #202 | Poor 17.2% |
| Ugandans | 17.5 /100 | #203 | Poor 17.2% |
| Iraqis | 13.0 /100 | #204 | Poor 17.4% |
| Immigrants | Cameroon | 12.6 /100 | #205 | Poor 17.4% |
| Delaware | 11.5 /100 | #206 | Poor 17.4% |
| Hmong | 10.6 /100 | #207 | Poor 17.5% |
| Sierra Leoneans | 8.9 /100 | #208 | Tragic 17.6% |
| Panamanians | 8.7 /100 | #209 | Tragic 17.6% |
| Immigrants | Immigrants | 7.3 /100 | #210 | Tragic 17.7% |
| Immigrants | Eastern Africa | 6.4 /100 | #211 | Tragic 17.7% |
| Immigrants | Thailand | 6.3 /100 | #212 | Tragic 17.7% |
| Pennsylvania Germans | 5.7 /100 | #213 | Tragic 17.8% |
| Malaysians | 5.7 /100 | #214 | Tragic 17.8% |
| German Russians | 5.7 /100 | #215 | Tragic 17.8% |