Osage vs Cuban Child Poverty Under the Age of 5
COMPARE
Osage
Cuban
Child Poverty Under the Age of 5
Child Poverty Under the Age of 5 Comparison
Osage
Cubans
19.6%
CHILD POVERTY UNDER THE AGE OF 5
0.5/ 100
METRIC RATING
243rd/ 347
METRIC RANK
19.1%
CHILD POVERTY UNDER THE AGE OF 5
1.7/ 100
METRIC RATING
223rd/ 347
METRIC RANK
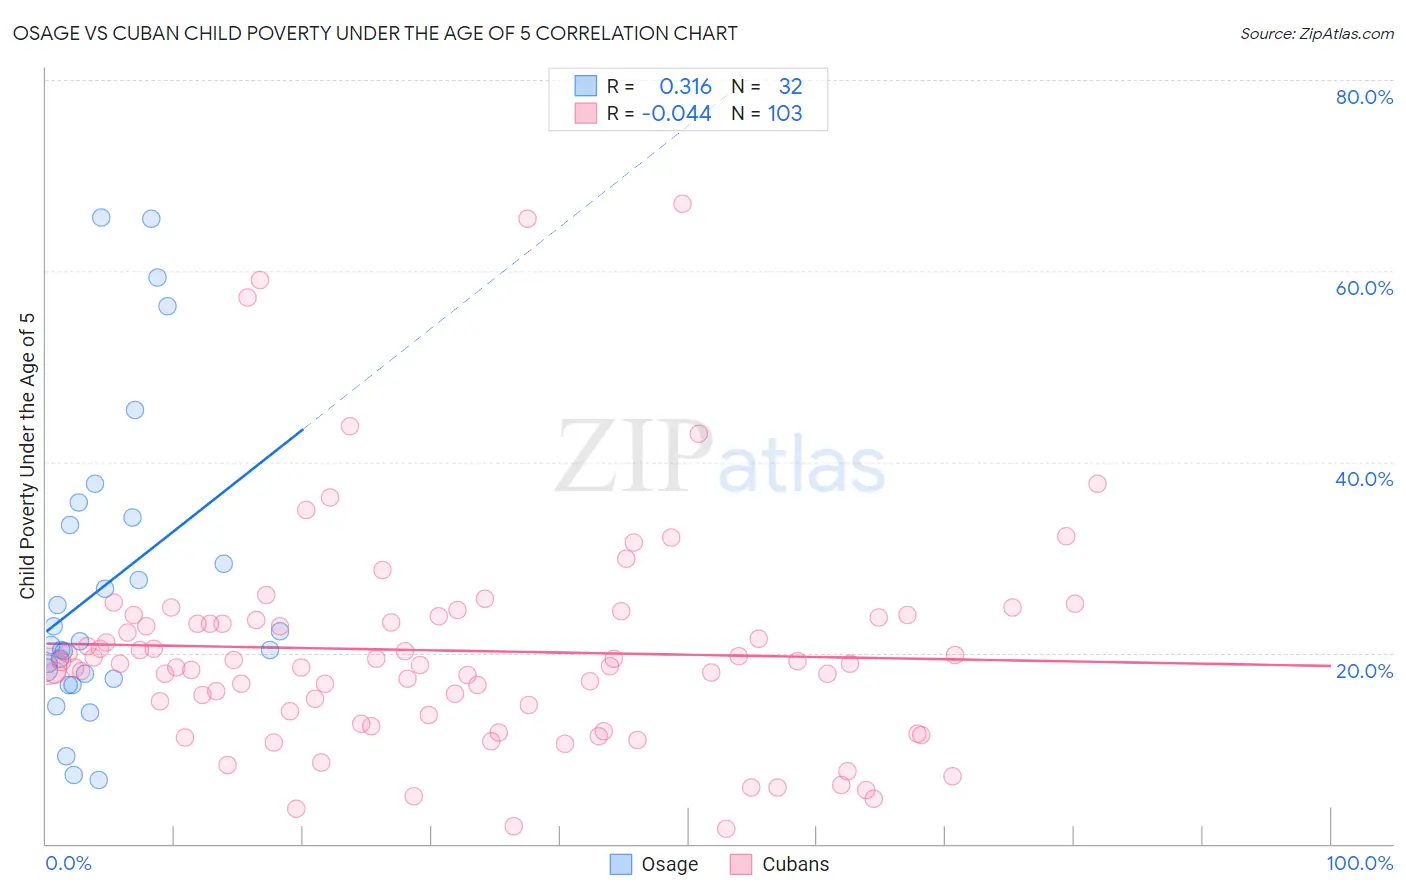
Osage vs Cuban Child Poverty Under the Age of 5 Correlation Chart
The statistical analysis conducted on geographies consisting of 90,936,218 people shows a mild positive correlation between the proportion of Osage and poverty level among children under the age of 5 in the United States with a correlation coefficient (R) of 0.316 and weighted average of 19.6%. Similarly, the statistical analysis conducted on geographies consisting of 429,948,450 people shows no correlation between the proportion of Cubans and poverty level among children under the age of 5 in the United States with a correlation coefficient (R) of -0.044 and weighted average of 19.1%, a difference of 3.1%.
Child Poverty Under the Age of 5 Correlation Summary
| Measurement | Osage | Cuban |
| Minimum | 6.7% | 1.6% |
| Maximum | 65.6% | 67.1% |
| Range | 59.0% | 65.5% |
| Mean | 27.0% | 20.2% |
| Median | 21.0% | 18.8% |
| Interquartile 25% (IQ1) | 17.5% | 13.5% |
| Interquartile 75% (IQ3) | 33.8% | 23.6% |
| Interquartile Range (IQR) | 16.2% | 10.1% |
| Standard Deviation (Sample) | 15.9% | 11.7% |
| Standard Deviation (Population) | 15.6% | 11.7% |
Demographics Similar to Osage and Cubans by Child Poverty Under the Age of 5
In terms of child poverty under the age of 5, the demographic groups most similar to Osage are Immigrants from Guyana (19.6%, a difference of 0.10%), Alaska Native (19.6%, a difference of 0.22%), Immigrants from Ecuador (19.6%, a difference of 0.28%), Vietnamese (19.5%, a difference of 0.66%), and Salvadoran (19.5%, a difference of 0.68%). Similarly, the demographic groups most similar to Cubans are Nicaraguan (19.1%, a difference of 0.11%), Nigerian (19.1%, a difference of 0.14%), Immigrants from Eritrea (19.1%, a difference of 0.16%), Cape Verdean (19.1%, a difference of 0.34%), and Immigrants from Sudan (19.2%, a difference of 0.65%).
| Demographics | Rating | Rank | Child Poverty Under the Age of 5 |
| Cubans | 1.7 /100 | #223 | Tragic 19.1% |
| Nicaraguans | 1.6 /100 | #224 | Tragic 19.1% |
| Nigerians | 1.6 /100 | #225 | Tragic 19.1% |
| Immigrants | Eritrea | 1.5 /100 | #226 | Tragic 19.1% |
| Cape Verdeans | 1.4 /100 | #227 | Tragic 19.1% |
| Immigrants | Sudan | 1.3 /100 | #228 | Tragic 19.2% |
| Ghanaians | 1.2 /100 | #229 | Tragic 19.2% |
| Ecuadorians | 1.2 /100 | #230 | Tragic 19.2% |
| Bermudans | 1.2 /100 | #231 | Tragic 19.2% |
| Trinidadians and Tobagonians | 0.9 /100 | #232 | Tragic 19.3% |
| Sudanese | 0.9 /100 | #233 | Tragic 19.3% |
| Immigrants | Micronesia | 0.9 /100 | #234 | Tragic 19.4% |
| Immigrants | Laos | 0.8 /100 | #235 | Tragic 19.4% |
| Immigrants | Trinidad and Tobago | 0.8 /100 | #236 | Tragic 19.4% |
| Immigrants | Cabo Verde | 0.6 /100 | #237 | Tragic 19.5% |
| Salvadorans | 0.6 /100 | #238 | Tragic 19.5% |
| Vietnamese | 0.6 /100 | #239 | Tragic 19.5% |
| Immigrants | Ecuador | 0.5 /100 | #240 | Tragic 19.6% |
| Alaska Natives | 0.5 /100 | #241 | Tragic 19.6% |
| Immigrants | Guyana | 0.5 /100 | #242 | Tragic 19.6% |
| Osage | 0.5 /100 | #243 | Tragic 19.6% |