Osage vs Cuban Unemployment Among Ages 25 to 29 years
COMPARE
Osage
Cuban
Unemployment Among Ages 25 to 29 years
Unemployment Among Ages 25 to 29 years Comparison
Osage
Cubans
6.7%
UNEMPLOYMENT AMONG AGES 25 TO 29 YEARS
48.1/ 100
METRIC RATING
176th/ 347
METRIC RANK
5.9%
UNEMPLOYMENT AMONG AGES 25 TO 29 YEARS
99.9/ 100
METRIC RATING
15th/ 347
METRIC RANK
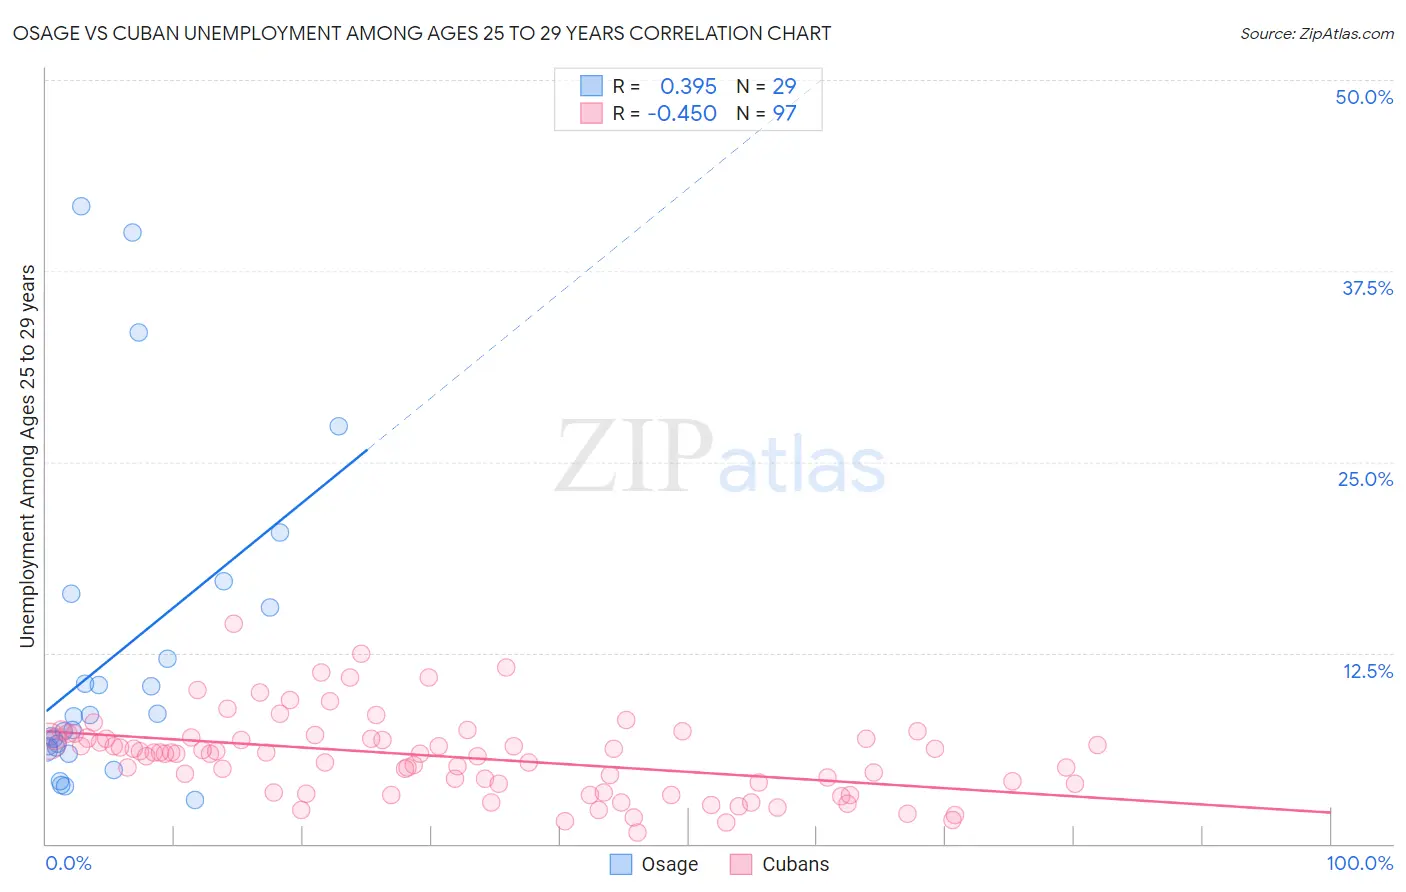
Osage vs Cuban Unemployment Among Ages 25 to 29 years Correlation Chart
The statistical analysis conducted on geographies consisting of 90,314,239 people shows a mild positive correlation between the proportion of Osage and unemployment rate among population between the ages 25 and 29 in the United States with a correlation coefficient (R) of 0.395 and weighted average of 6.7%. Similarly, the statistical analysis conducted on geographies consisting of 424,519,205 people shows a moderate negative correlation between the proportion of Cubans and unemployment rate among population between the ages 25 and 29 in the United States with a correlation coefficient (R) of -0.450 and weighted average of 5.9%, a difference of 12.6%.
Unemployment Among Ages 25 to 29 years Correlation Summary
| Measurement | Osage | Cuban |
| Minimum | 2.9% | 0.70% |
| Maximum | 41.7% | 14.4% |
| Range | 38.8% | 13.7% |
| Mean | 12.4% | 5.7% |
| Median | 8.4% | 5.9% |
| Interquartile 25% (IQ1) | 6.2% | 3.6% |
| Interquartile 75% (IQ3) | 16.0% | 6.9% |
| Interquartile Range (IQR) | 9.8% | 3.3% |
| Standard Deviation (Sample) | 10.6% | 2.6% |
| Standard Deviation (Population) | 10.4% | 2.6% |
Similar Demographics by Unemployment Among Ages 25 to 29 years
Demographics Similar to Osage by Unemployment Among Ages 25 to 29 years
In terms of unemployment among ages 25 to 29 years, the demographic groups most similar to Osage are Immigrants from Israel (6.7%, a difference of 0.020%), Immigrants from South Eastern Asia (6.7%, a difference of 0.060%), Immigrants from North America (6.6%, a difference of 0.12%), Immigrants from Iraq (6.7%, a difference of 0.18%), and Costa Rican (6.7%, a difference of 0.19%).
| Demographics | Rating | Rank | Unemployment Among Ages 25 to 29 years |
| South Americans | 54.5 /100 | #169 | Average 6.6% |
| Albanians | 53.5 /100 | #170 | Average 6.6% |
| Immigrants | Cambodia | 52.6 /100 | #171 | Average 6.6% |
| Bangladeshis | 51.6 /100 | #172 | Average 6.6% |
| Russians | 51.3 /100 | #173 | Average 6.6% |
| Immigrants | North America | 50.0 /100 | #174 | Average 6.6% |
| Immigrants | South Eastern Asia | 49.1 /100 | #175 | Average 6.7% |
| Osage | 48.1 /100 | #176 | Average 6.7% |
| Immigrants | Israel | 47.8 /100 | #177 | Average 6.7% |
| Immigrants | Iraq | 45.1 /100 | #178 | Average 6.7% |
| Costa Ricans | 44.9 /100 | #179 | Average 6.7% |
| Immigrants | Africa | 41.1 /100 | #180 | Average 6.7% |
| Immigrants | Western Europe | 41.1 /100 | #181 | Average 6.7% |
| Czechoslovakians | 40.7 /100 | #182 | Average 6.7% |
| Immigrants | Scotland | 39.6 /100 | #183 | Fair 6.7% |
Demographics Similar to Cubans by Unemployment Among Ages 25 to 29 years
In terms of unemployment among ages 25 to 29 years, the demographic groups most similar to Cubans are Immigrants from Bulgaria (5.9%, a difference of 0.010%), Bolivian (5.9%, a difference of 0.15%), Immigrants from Singapore (5.9%, a difference of 0.26%), Immigrants from Kuwait (5.9%, a difference of 0.35%), and Thai (5.9%, a difference of 0.41%).
| Demographics | Rating | Rank | Unemployment Among Ages 25 to 29 years |
| Immigrants | Bosnia and Herzegovina | 100.0 /100 | #8 | Exceptional 5.7% |
| Immigrants | Nepal | 100.0 /100 | #9 | Exceptional 5.7% |
| Immigrants | Sudan | 100.0 /100 | #10 | Exceptional 5.8% |
| Cambodians | 100.0 /100 | #11 | Exceptional 5.8% |
| Okinawans | 100.0 /100 | #12 | Exceptional 5.9% |
| Immigrants | Bolivia | 100.0 /100 | #13 | Exceptional 5.9% |
| Immigrants | Kuwait | 99.9 /100 | #14 | Exceptional 5.9% |
| Cubans | 99.9 /100 | #15 | Exceptional 5.9% |
| Immigrants | Bulgaria | 99.9 /100 | #16 | Exceptional 5.9% |
| Bolivians | 99.9 /100 | #17 | Exceptional 5.9% |
| Immigrants | Singapore | 99.9 /100 | #18 | Exceptional 5.9% |
| Thais | 99.9 /100 | #19 | Exceptional 5.9% |
| Immigrants | Eritrea | 99.9 /100 | #20 | Exceptional 5.9% |
| Immigrants | Ethiopia | 99.9 /100 | #21 | Exceptional 6.0% |
| Immigrants | Japan | 99.9 /100 | #22 | Exceptional 6.0% |