Austrian vs Cuban Child Poverty Under the Age of 5
COMPARE
Austrian
Cuban
Child Poverty Under the Age of 5
Child Poverty Under the Age of 5 Comparison
Austrians
Cubans
16.1%
CHILD POVERTY UNDER THE AGE OF 5
92.0/ 100
METRIC RATING
123rd/ 347
METRIC RANK
19.1%
CHILD POVERTY UNDER THE AGE OF 5
1.7/ 100
METRIC RATING
223rd/ 347
METRIC RANK
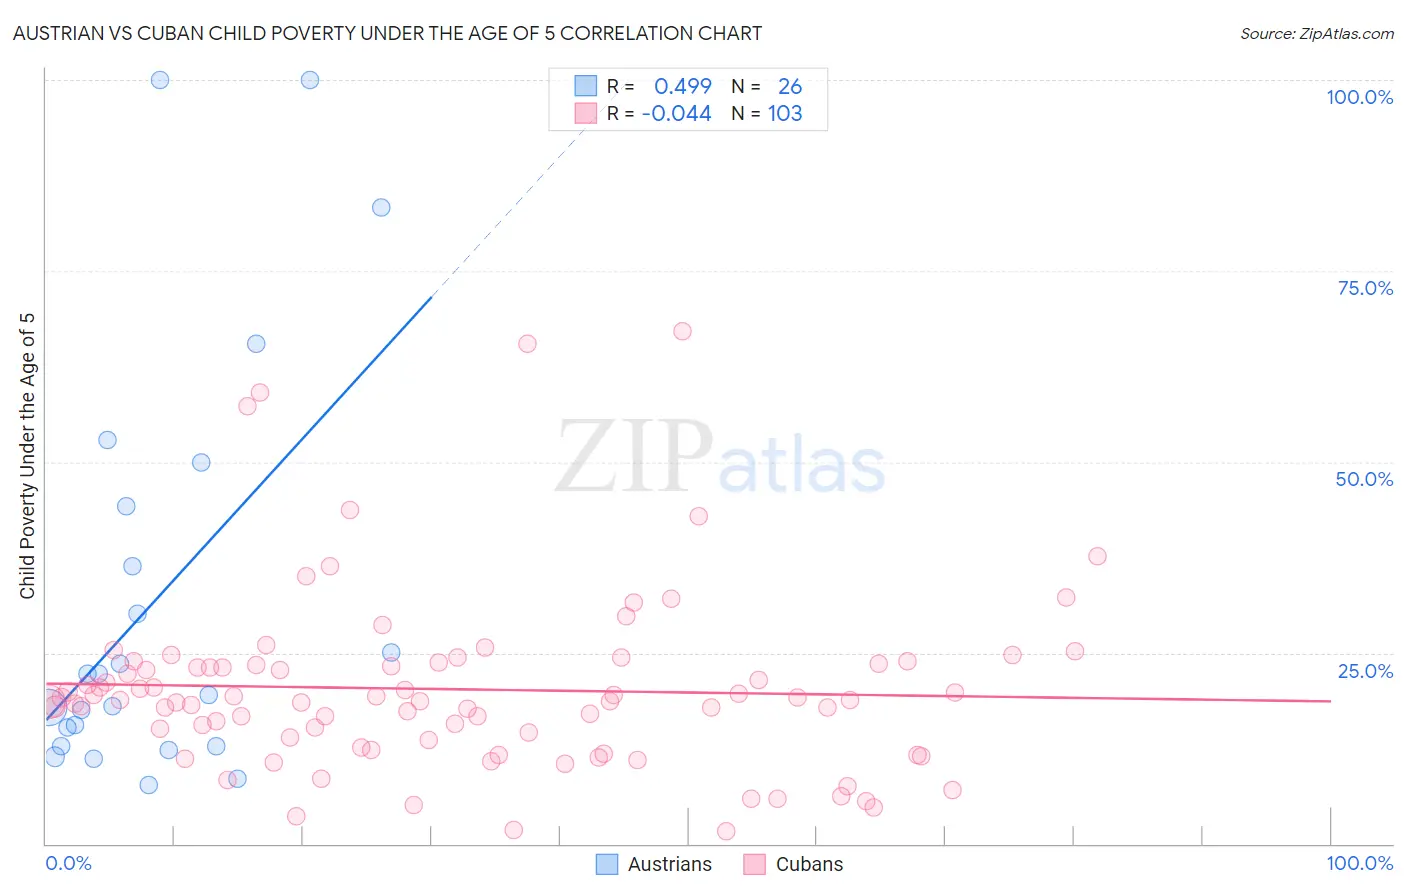
Austrian vs Cuban Child Poverty Under the Age of 5 Correlation Chart
The statistical analysis conducted on geographies consisting of 426,879,815 people shows a moderate positive correlation between the proportion of Austrians and poverty level among children under the age of 5 in the United States with a correlation coefficient (R) of 0.499 and weighted average of 16.1%. Similarly, the statistical analysis conducted on geographies consisting of 429,948,450 people shows no correlation between the proportion of Cubans and poverty level among children under the age of 5 in the United States with a correlation coefficient (R) of -0.044 and weighted average of 19.1%, a difference of 18.1%.
Child Poverty Under the Age of 5 Correlation Summary
| Measurement | Austrian | Cuban |
| Minimum | 7.7% | 1.6% |
| Maximum | 100.0% | 67.1% |
| Range | 92.3% | 65.5% |
| Mean | 32.1% | 20.2% |
| Median | 20.8% | 18.8% |
| Interquartile 25% (IQ1) | 12.8% | 13.5% |
| Interquartile 75% (IQ3) | 44.1% | 23.6% |
| Interquartile Range (IQR) | 31.3% | 10.1% |
| Standard Deviation (Sample) | 27.3% | 11.7% |
| Standard Deviation (Population) | 26.8% | 11.7% |
Similar Demographics by Child Poverty Under the Age of 5
Demographics Similar to Austrians by Child Poverty Under the Age of 5
In terms of child poverty under the age of 5, the demographic groups most similar to Austrians are Swiss (16.1%, a difference of 0.010%), Immigrants from Southern Europe (16.1%, a difference of 0.030%), Native Hawaiian (16.2%, a difference of 0.080%), Immigrants from Albania (16.2%, a difference of 0.080%), and Immigrants from England (16.2%, a difference of 0.17%).
| Demographics | Rating | Rank | Child Poverty Under the Age of 5 |
| Immigrants | Austria | 93.5 /100 | #116 | Exceptional 16.0% |
| Basques | 93.4 /100 | #117 | Exceptional 16.0% |
| Immigrants | Denmark | 93.4 /100 | #118 | Exceptional 16.0% |
| Immigrants | Jordan | 93.2 /100 | #119 | Exceptional 16.1% |
| Immigrants | Peru | 92.6 /100 | #120 | Exceptional 16.1% |
| Mongolians | 92.5 /100 | #121 | Exceptional 16.1% |
| Immigrants | Southern Europe | 92.0 /100 | #122 | Exceptional 16.1% |
| Austrians | 92.0 /100 | #123 | Exceptional 16.1% |
| Swiss | 92.0 /100 | #124 | Exceptional 16.1% |
| Native Hawaiians | 91.8 /100 | #125 | Exceptional 16.2% |
| Immigrants | Albania | 91.8 /100 | #126 | Exceptional 16.2% |
| Immigrants | England | 91.5 /100 | #127 | Exceptional 16.2% |
| South Africans | 90.1 /100 | #128 | Exceptional 16.2% |
| British | 89.4 /100 | #129 | Excellent 16.3% |
| Immigrants | Norway | 89.3 /100 | #130 | Excellent 16.3% |
Demographics Similar to Cubans by Child Poverty Under the Age of 5
In terms of child poverty under the age of 5, the demographic groups most similar to Cubans are Alsatian (19.1%, a difference of 0.020%), Nicaraguan (19.1%, a difference of 0.11%), Nigerian (19.1%, a difference of 0.14%), Immigrants from Eritrea (19.1%, a difference of 0.16%), and Cape Verdean (19.1%, a difference of 0.34%).
| Demographics | Rating | Rank | Child Poverty Under the Age of 5 |
| Hmong | 5.0 /100 | #216 | Tragic 18.5% |
| Immigrants | Africa | 4.6 /100 | #217 | Tragic 18.6% |
| Delaware | 3.4 /100 | #218 | Tragic 18.7% |
| German Russians | 3.0 /100 | #219 | Tragic 18.8% |
| Immigrants | Azores | 2.6 /100 | #220 | Tragic 18.9% |
| Immigrants | Nigeria | 2.1 /100 | #221 | Tragic 19.0% |
| Alsatians | 1.7 /100 | #222 | Tragic 19.1% |
| Cubans | 1.7 /100 | #223 | Tragic 19.1% |
| Nicaraguans | 1.6 /100 | #224 | Tragic 19.1% |
| Nigerians | 1.6 /100 | #225 | Tragic 19.1% |
| Immigrants | Eritrea | 1.5 /100 | #226 | Tragic 19.1% |
| Cape Verdeans | 1.4 /100 | #227 | Tragic 19.1% |
| Immigrants | Sudan | 1.3 /100 | #228 | Tragic 19.2% |
| Ghanaians | 1.2 /100 | #229 | Tragic 19.2% |
| Ecuadorians | 1.2 /100 | #230 | Tragic 19.2% |