Osage vs Immigrants from Lebanon Child Poverty Under the Age of 5
COMPARE
Osage
Immigrants from Lebanon
Child Poverty Under the Age of 5
Child Poverty Under the Age of 5 Comparison
Osage
Immigrants from Lebanon
19.6%
CHILD POVERTY UNDER THE AGE OF 5
0.5/ 100
METRIC RATING
243rd/ 347
METRIC RANK
17.3%
CHILD POVERTY UNDER THE AGE OF 5
47.6/ 100
METRIC RATING
175th/ 347
METRIC RANK
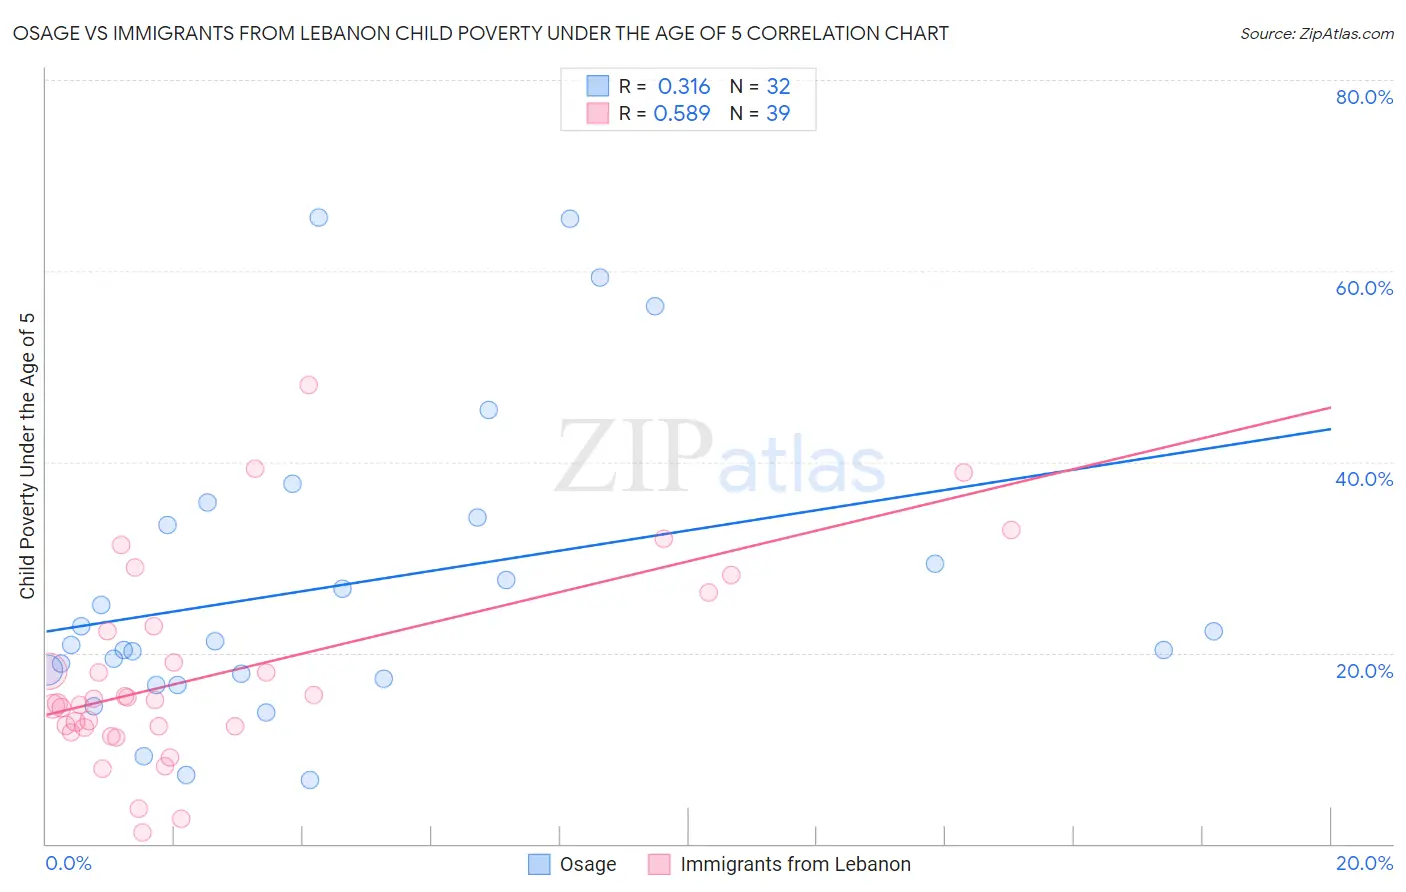
Osage vs Immigrants from Lebanon Child Poverty Under the Age of 5 Correlation Chart
The statistical analysis conducted on geographies consisting of 90,936,218 people shows a mild positive correlation between the proportion of Osage and poverty level among children under the age of 5 in the United States with a correlation coefficient (R) of 0.316 and weighted average of 19.6%. Similarly, the statistical analysis conducted on geographies consisting of 210,438,499 people shows a substantial positive correlation between the proportion of Immigrants from Lebanon and poverty level among children under the age of 5 in the United States with a correlation coefficient (R) of 0.589 and weighted average of 17.3%, a difference of 13.7%.
Child Poverty Under the Age of 5 Correlation Summary
| Measurement | Osage | Immigrants from Lebanon |
| Minimum | 6.7% | 1.2% |
| Maximum | 65.6% | 48.0% |
| Range | 59.0% | 46.9% |
| Mean | 27.0% | 17.9% |
| Median | 21.0% | 15.0% |
| Interquartile 25% (IQ1) | 17.5% | 12.1% |
| Interquartile 75% (IQ3) | 33.8% | 22.8% |
| Interquartile Range (IQR) | 16.2% | 10.7% |
| Standard Deviation (Sample) | 15.9% | 10.4% |
| Standard Deviation (Population) | 15.6% | 10.3% |
Similar Demographics by Child Poverty Under the Age of 5
Demographics Similar to Osage by Child Poverty Under the Age of 5
In terms of child poverty under the age of 5, the demographic groups most similar to Osage are Immigrants from Ghana (19.6%, a difference of 0.020%), Immigrants from Guyana (19.6%, a difference of 0.10%), Immigrants from Western Africa (19.7%, a difference of 0.21%), Alaska Native (19.6%, a difference of 0.22%), and Immigrants from Ecuador (19.6%, a difference of 0.28%).
| Demographics | Rating | Rank | Child Poverty Under the Age of 5 |
| Immigrants | Trinidad and Tobago | 0.8 /100 | #236 | Tragic 19.4% |
| Immigrants | Cabo Verde | 0.6 /100 | #237 | Tragic 19.5% |
| Salvadorans | 0.6 /100 | #238 | Tragic 19.5% |
| Vietnamese | 0.6 /100 | #239 | Tragic 19.5% |
| Immigrants | Ecuador | 0.5 /100 | #240 | Tragic 19.6% |
| Alaska Natives | 0.5 /100 | #241 | Tragic 19.6% |
| Immigrants | Guyana | 0.5 /100 | #242 | Tragic 19.6% |
| Osage | 0.5 /100 | #243 | Tragic 19.6% |
| Immigrants | Ghana | 0.5 /100 | #244 | Tragic 19.6% |
| Immigrants | Western Africa | 0.4 /100 | #245 | Tragic 19.7% |
| Cree | 0.4 /100 | #246 | Tragic 19.7% |
| Guyanese | 0.4 /100 | #247 | Tragic 19.7% |
| Marshallese | 0.4 /100 | #248 | Tragic 19.7% |
| Immigrants | Middle Africa | 0.4 /100 | #249 | Tragic 19.7% |
| Immigrants | Nonimmigrants | 0.4 /100 | #250 | Tragic 19.7% |
Demographics Similar to Immigrants from Lebanon by Child Poverty Under the Age of 5
In terms of child poverty under the age of 5, the demographic groups most similar to Immigrants from Lebanon are Immigrants from Saudi Arabia (17.2%, a difference of 0.25%), Immigrants from Iraq (17.3%, a difference of 0.25%), Immigrants from Sierra Leone (17.3%, a difference of 0.41%), Immigrants from Cameroon (17.4%, a difference of 0.51%), and Hawaiian (17.4%, a difference of 0.64%).
| Demographics | Rating | Rank | Child Poverty Under the Age of 5 |
| Uruguayans | 60.5 /100 | #168 | Good 17.0% |
| Immigrants | South America | 60.0 /100 | #169 | Good 17.1% |
| Immigrants | Western Asia | 59.2 /100 | #170 | Average 17.1% |
| Immigrants | Morocco | 58.9 /100 | #171 | Average 17.1% |
| Yugoslavians | 54.1 /100 | #172 | Average 17.2% |
| Welsh | 54.0 /100 | #173 | Average 17.2% |
| Immigrants | Saudi Arabia | 50.0 /100 | #174 | Average 17.2% |
| Immigrants | Lebanon | 47.6 /100 | #175 | Average 17.3% |
| Immigrants | Iraq | 45.2 /100 | #176 | Average 17.3% |
| Immigrants | Sierra Leone | 43.6 /100 | #177 | Average 17.3% |
| Immigrants | Cameroon | 42.7 /100 | #178 | Average 17.4% |
| Hawaiians | 41.5 /100 | #179 | Average 17.4% |
| South American Indians | 41.4 /100 | #180 | Average 17.4% |
| Immigrants | Germany | 41.0 /100 | #181 | Average 17.4% |
| Arabs | 40.7 /100 | #182 | Average 17.4% |