Senegalese vs Cuban Child Poverty Under the Age of 5
COMPARE
Senegalese
Cuban
Child Poverty Under the Age of 5
Child Poverty Under the Age of 5 Comparison
Senegalese
Cubans
20.9%
CHILD POVERTY UNDER THE AGE OF 5
0.0/ 100
METRIC RATING
281st/ 347
METRIC RANK
19.1%
CHILD POVERTY UNDER THE AGE OF 5
1.7/ 100
METRIC RATING
223rd/ 347
METRIC RANK
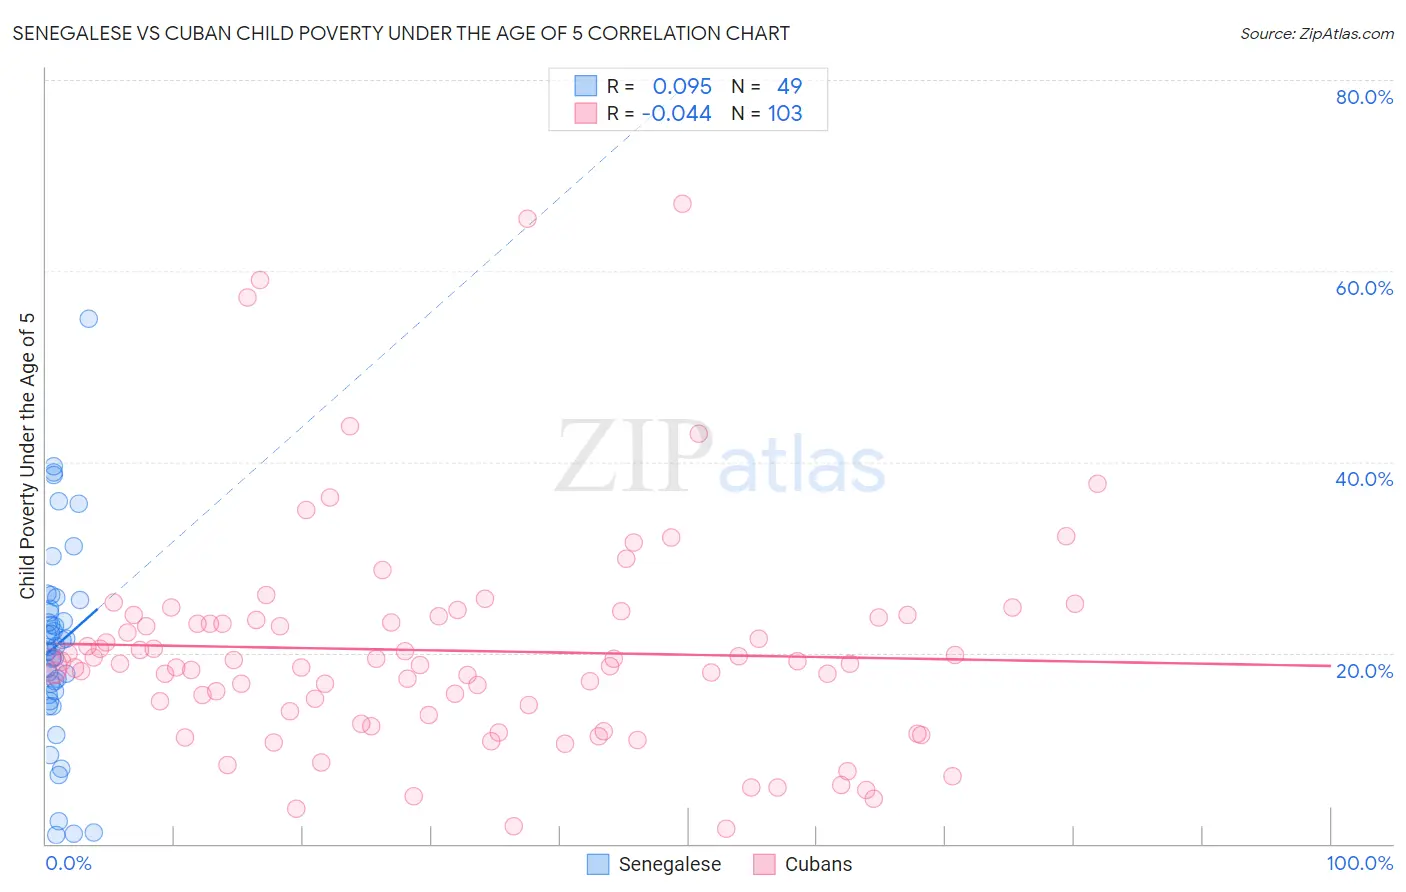
Senegalese vs Cuban Child Poverty Under the Age of 5 Correlation Chart
The statistical analysis conducted on geographies consisting of 77,581,902 people shows a slight positive correlation between the proportion of Senegalese and poverty level among children under the age of 5 in the United States with a correlation coefficient (R) of 0.095 and weighted average of 20.9%. Similarly, the statistical analysis conducted on geographies consisting of 429,948,450 people shows no correlation between the proportion of Cubans and poverty level among children under the age of 5 in the United States with a correlation coefficient (R) of -0.044 and weighted average of 19.1%, a difference of 9.6%.
Child Poverty Under the Age of 5 Correlation Summary
| Measurement | Senegalese | Cuban |
| Minimum | 0.87% | 1.6% |
| Maximum | 55.0% | 67.1% |
| Range | 54.1% | 65.5% |
| Mean | 20.8% | 20.2% |
| Median | 20.6% | 18.8% |
| Interquartile 25% (IQ1) | 15.8% | 13.5% |
| Interquartile 75% (IQ3) | 25.1% | 23.6% |
| Interquartile Range (IQR) | 9.3% | 10.1% |
| Standard Deviation (Sample) | 10.5% | 11.7% |
| Standard Deviation (Population) | 10.4% | 11.7% |
Similar Demographics by Child Poverty Under the Age of 5
Demographics Similar to Senegalese by Child Poverty Under the Age of 5
In terms of child poverty under the age of 5, the demographic groups most similar to Senegalese are French American Indian (20.8%, a difference of 0.23%), Potawatomi (21.0%, a difference of 0.54%), Subsaharan African (20.8%, a difference of 0.64%), Comanche (21.0%, a difference of 0.74%), and Immigrants from Grenada (20.7%, a difference of 1.0%).
| Demographics | Rating | Rank | Child Poverty Under the Age of 5 |
| Immigrants | Belize | 0.1 /100 | #274 | Tragic 20.6% |
| Bangladeshis | 0.1 /100 | #275 | Tragic 20.6% |
| West Indians | 0.0 /100 | #276 | Tragic 20.6% |
| Immigrants | West Indies | 0.0 /100 | #277 | Tragic 20.7% |
| Immigrants | Grenada | 0.0 /100 | #278 | Tragic 20.7% |
| Sub-Saharan Africans | 0.0 /100 | #279 | Tragic 20.8% |
| French American Indians | 0.0 /100 | #280 | Tragic 20.8% |
| Senegalese | 0.0 /100 | #281 | Tragic 20.9% |
| Potawatomi | 0.0 /100 | #282 | Tragic 21.0% |
| Comanche | 0.0 /100 | #283 | Tragic 21.0% |
| Somalis | 0.0 /100 | #284 | Tragic 21.1% |
| Haitians | 0.0 /100 | #285 | Tragic 21.2% |
| Immigrants | Latin America | 0.0 /100 | #286 | Tragic 21.2% |
| Immigrants | Zaire | 0.0 /100 | #287 | Tragic 21.3% |
| Immigrants | Senegal | 0.0 /100 | #288 | Tragic 21.3% |
Demographics Similar to Cubans by Child Poverty Under the Age of 5
In terms of child poverty under the age of 5, the demographic groups most similar to Cubans are Alsatian (19.1%, a difference of 0.020%), Nicaraguan (19.1%, a difference of 0.11%), Nigerian (19.1%, a difference of 0.14%), Immigrants from Eritrea (19.1%, a difference of 0.16%), and Cape Verdean (19.1%, a difference of 0.34%).
| Demographics | Rating | Rank | Child Poverty Under the Age of 5 |
| Hmong | 5.0 /100 | #216 | Tragic 18.5% |
| Immigrants | Africa | 4.6 /100 | #217 | Tragic 18.6% |
| Delaware | 3.4 /100 | #218 | Tragic 18.7% |
| German Russians | 3.0 /100 | #219 | Tragic 18.8% |
| Immigrants | Azores | 2.6 /100 | #220 | Tragic 18.9% |
| Immigrants | Nigeria | 2.1 /100 | #221 | Tragic 19.0% |
| Alsatians | 1.7 /100 | #222 | Tragic 19.1% |
| Cubans | 1.7 /100 | #223 | Tragic 19.1% |
| Nicaraguans | 1.6 /100 | #224 | Tragic 19.1% |
| Nigerians | 1.6 /100 | #225 | Tragic 19.1% |
| Immigrants | Eritrea | 1.5 /100 | #226 | Tragic 19.1% |
| Cape Verdeans | 1.4 /100 | #227 | Tragic 19.1% |
| Immigrants | Sudan | 1.3 /100 | #228 | Tragic 19.2% |
| Ghanaians | 1.2 /100 | #229 | Tragic 19.2% |
| Ecuadorians | 1.2 /100 | #230 | Tragic 19.2% |