Nonimmigrants vs British West Indian Male Poverty
COMPARE
Nonimmigrants
British West Indian
Male Poverty
Male Poverty Comparison
Nonimmigrants
British West Indians
12.1%
MALE POVERTY
3.1/ 100
METRIC RATING
213th/ 347
METRIC RANK
14.6%
MALE POVERTY
0.0/ 100
METRIC RATING
316th/ 347
METRIC RANK
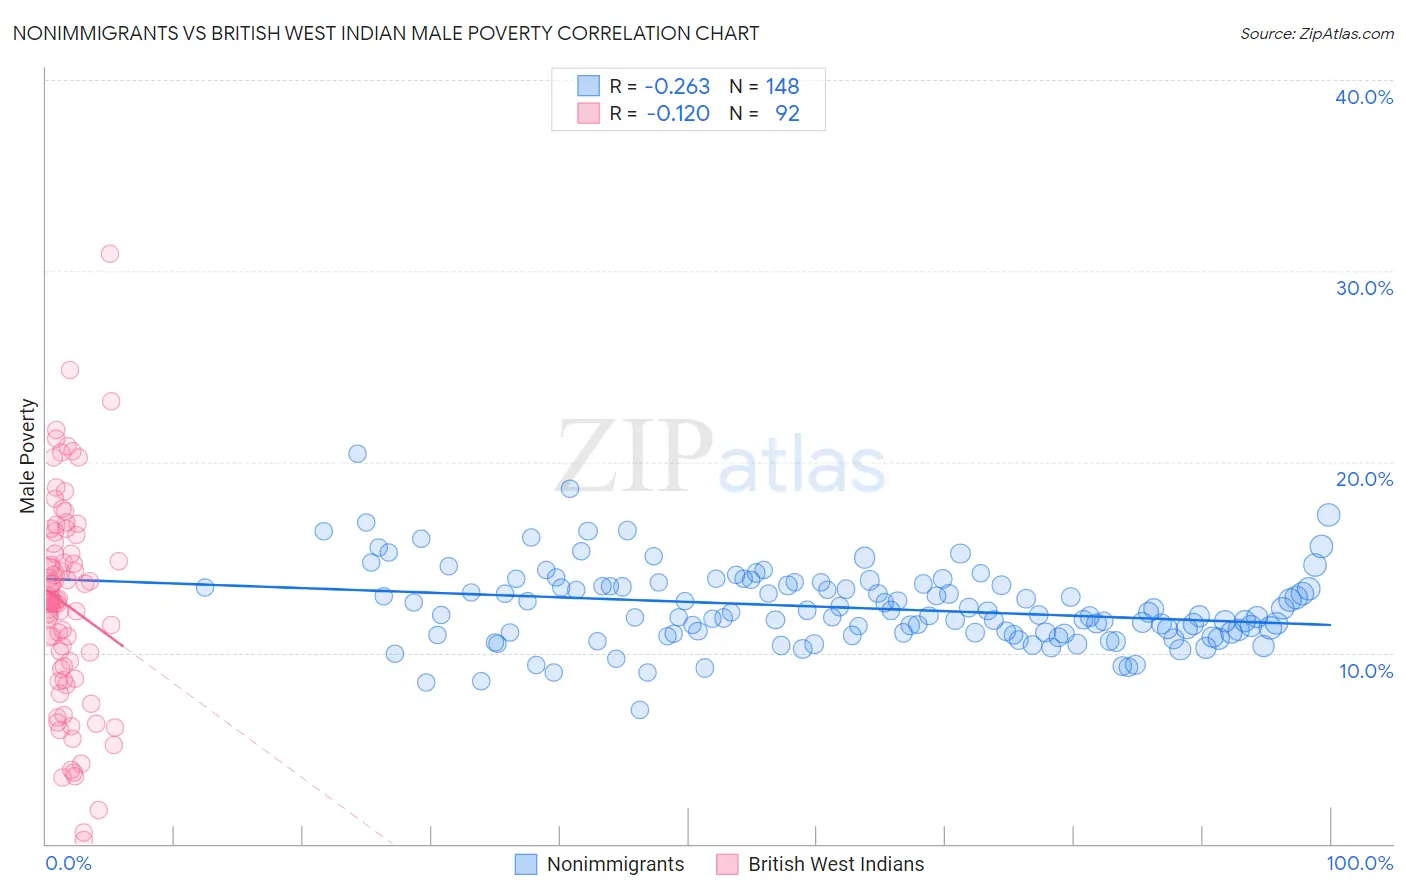
Nonimmigrants vs British West Indian Male Poverty Correlation Chart
The statistical analysis conducted on geographies consisting of 582,696,583 people shows a weak negative correlation between the proportion of Nonimmigrants and poverty level among males in the United States with a correlation coefficient (R) of -0.263 and weighted average of 12.1%. Similarly, the statistical analysis conducted on geographies consisting of 152,618,428 people shows a poor negative correlation between the proportion of British West Indians and poverty level among males in the United States with a correlation coefficient (R) of -0.120 and weighted average of 14.6%, a difference of 20.3%.
Male Poverty Correlation Summary
| Measurement | Nonimmigrants | British West Indian |
| Minimum | 7.0% | 0.21% |
| Maximum | 20.4% | 30.9% |
| Range | 13.4% | 30.7% |
| Mean | 12.4% | 12.5% |
| Median | 12.0% | 12.7% |
| Interquartile 25% (IQ1) | 11.0% | 8.9% |
| Interquartile 75% (IQ3) | 13.5% | 15.5% |
| Interquartile Range (IQR) | 2.5% | 6.6% |
| Standard Deviation (Sample) | 2.0% | 5.5% |
| Standard Deviation (Population) | 2.0% | 5.5% |
Similar Demographics by Male Poverty
Demographics Similar to Nonimmigrants by Male Poverty
In terms of male poverty, the demographic groups most similar to Nonimmigrants are American (12.1%, a difference of 0.040%), Japanese (12.2%, a difference of 0.32%), Immigrants from Uzbekistan (12.2%, a difference of 0.43%), Immigrants from Cambodia (12.2%, a difference of 0.51%), and Immigrants from Thailand (12.2%, a difference of 0.52%).
| Demographics | Rating | Rank | Male Poverty |
| Immigrants | Eastern Africa | 5.4 /100 | #206 | Tragic 12.0% |
| Malaysians | 5.2 /100 | #207 | Tragic 12.0% |
| Immigrants | Immigrants | 4.5 /100 | #208 | Tragic 12.0% |
| Immigrants | Azores | 4.3 /100 | #209 | Tragic 12.0% |
| Moroccans | 4.2 /100 | #210 | Tragic 12.0% |
| Immigrants | Panama | 4.0 /100 | #211 | Tragic 12.1% |
| Americans | 3.2 /100 | #212 | Tragic 12.1% |
| Immigrants | Nonimmigrants | 3.1 /100 | #213 | Tragic 12.1% |
| Japanese | 2.7 /100 | #214 | Tragic 12.2% |
| Immigrants | Uzbekistan | 2.6 /100 | #215 | Tragic 12.2% |
| Immigrants | Cambodia | 2.5 /100 | #216 | Tragic 12.2% |
| Immigrants | Thailand | 2.5 /100 | #217 | Tragic 12.2% |
| German Russians | 2.5 /100 | #218 | Tragic 12.2% |
| Bermudans | 2.4 /100 | #219 | Tragic 12.2% |
| Immigrants | Eritrea | 2.4 /100 | #220 | Tragic 12.2% |
Demographics Similar to British West Indians by Male Poverty
In terms of male poverty, the demographic groups most similar to British West Indians are Chippewa (14.6%, a difference of 0.020%), Immigrants from Honduras (14.6%, a difference of 0.10%), Immigrants from Somalia (14.6%, a difference of 0.14%), Immigrants from Dominica (14.7%, a difference of 0.68%), and Immigrants from Grenada (14.7%, a difference of 0.74%).
| Demographics | Rating | Rank | Male Poverty |
| Somalis | 0.0 /100 | #309 | Tragic 14.3% |
| Seminole | 0.0 /100 | #310 | Tragic 14.3% |
| Hondurans | 0.0 /100 | #311 | Tragic 14.3% |
| Choctaw | 0.0 /100 | #312 | Tragic 14.4% |
| Immigrants | Somalia | 0.0 /100 | #313 | Tragic 14.6% |
| Immigrants | Honduras | 0.0 /100 | #314 | Tragic 14.6% |
| Chippewa | 0.0 /100 | #315 | Tragic 14.6% |
| British West Indians | 0.0 /100 | #316 | Tragic 14.6% |
| Immigrants | Dominica | 0.0 /100 | #317 | Tragic 14.7% |
| Immigrants | Grenada | 0.0 /100 | #318 | Tragic 14.7% |
| U.S. Virgin Islanders | 0.0 /100 | #319 | Tragic 14.7% |
| Immigrants | Congo | 0.0 /100 | #320 | Tragic 14.7% |
| Arapaho | 0.0 /100 | #321 | Tragic 15.1% |
| Kiowa | 0.0 /100 | #322 | Tragic 15.2% |
| Colville | 0.0 /100 | #323 | Tragic 15.2% |