Nonimmigrants vs Immigrants from Moldova Male Poverty
COMPARE
Nonimmigrants
Immigrants from Moldova
Male Poverty
Male Poverty Comparison
Nonimmigrants
Immigrants from Moldova
12.1%
MALE POVERTY
3.1/ 100
METRIC RATING
213th/ 347
METRIC RANK
9.9%
MALE POVERTY
99.0/ 100
METRIC RATING
43rd/ 347
METRIC RANK
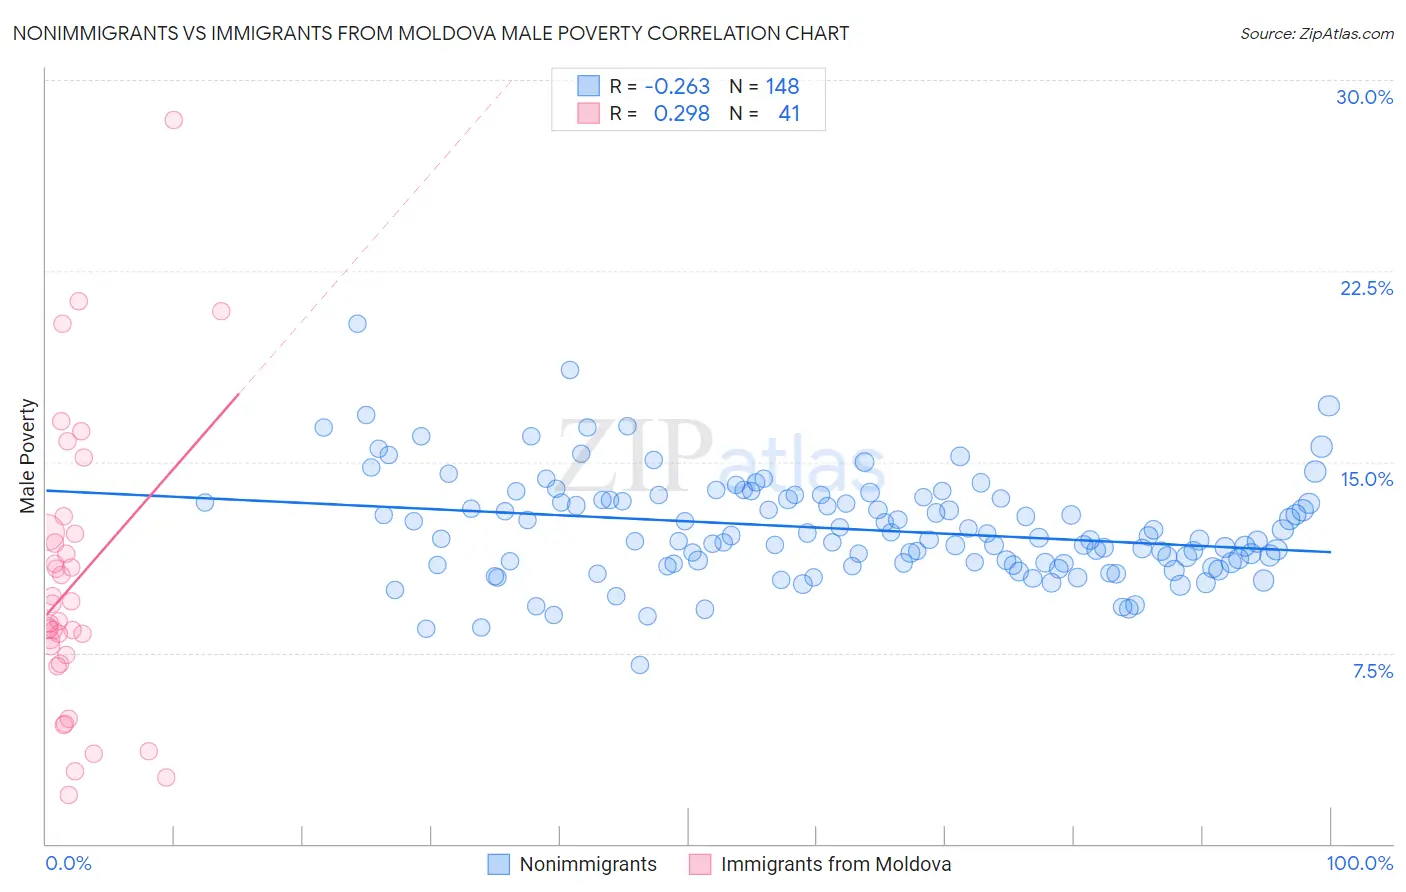
Nonimmigrants vs Immigrants from Moldova Male Poverty Correlation Chart
The statistical analysis conducted on geographies consisting of 582,696,583 people shows a weak negative correlation between the proportion of Nonimmigrants and poverty level among males in the United States with a correlation coefficient (R) of -0.263 and weighted average of 12.1%. Similarly, the statistical analysis conducted on geographies consisting of 124,352,223 people shows a weak positive correlation between the proportion of Immigrants from Moldova and poverty level among males in the United States with a correlation coefficient (R) of 0.298 and weighted average of 9.9%, a difference of 22.3%.
Male Poverty Correlation Summary
| Measurement | Nonimmigrants | Immigrants from Moldova |
| Minimum | 7.0% | 1.9% |
| Maximum | 20.4% | 28.4% |
| Range | 13.4% | 26.5% |
| Mean | 12.4% | 10.3% |
| Median | 12.0% | 8.8% |
| Interquartile 25% (IQ1) | 11.0% | 7.2% |
| Interquartile 75% (IQ3) | 13.5% | 12.2% |
| Interquartile Range (IQR) | 2.5% | 5.0% |
| Standard Deviation (Sample) | 2.0% | 5.6% |
| Standard Deviation (Population) | 2.0% | 5.5% |
Similar Demographics by Male Poverty
Demographics Similar to Nonimmigrants by Male Poverty
In terms of male poverty, the demographic groups most similar to Nonimmigrants are American (12.1%, a difference of 0.040%), Japanese (12.2%, a difference of 0.32%), Immigrants from Uzbekistan (12.2%, a difference of 0.43%), Immigrants from Cambodia (12.2%, a difference of 0.51%), and Immigrants from Thailand (12.2%, a difference of 0.52%).
| Demographics | Rating | Rank | Male Poverty |
| Immigrants | Eastern Africa | 5.4 /100 | #206 | Tragic 12.0% |
| Malaysians | 5.2 /100 | #207 | Tragic 12.0% |
| Immigrants | Immigrants | 4.5 /100 | #208 | Tragic 12.0% |
| Immigrants | Azores | 4.3 /100 | #209 | Tragic 12.0% |
| Moroccans | 4.2 /100 | #210 | Tragic 12.0% |
| Immigrants | Panama | 4.0 /100 | #211 | Tragic 12.1% |
| Americans | 3.2 /100 | #212 | Tragic 12.1% |
| Immigrants | Nonimmigrants | 3.1 /100 | #213 | Tragic 12.1% |
| Japanese | 2.7 /100 | #214 | Tragic 12.2% |
| Immigrants | Uzbekistan | 2.6 /100 | #215 | Tragic 12.2% |
| Immigrants | Cambodia | 2.5 /100 | #216 | Tragic 12.2% |
| Immigrants | Thailand | 2.5 /100 | #217 | Tragic 12.2% |
| German Russians | 2.5 /100 | #218 | Tragic 12.2% |
| Bermudans | 2.4 /100 | #219 | Tragic 12.2% |
| Immigrants | Eritrea | 2.4 /100 | #220 | Tragic 12.2% |
Demographics Similar to Immigrants from Moldova by Male Poverty
In terms of male poverty, the demographic groups most similar to Immigrants from Moldova are Immigrants from Romania (9.9%, a difference of 0.22%), Immigrants from Iran (9.9%, a difference of 0.26%), Immigrants from Serbia (10.0%, a difference of 0.40%), Turkish (10.0%, a difference of 0.42%), and Korean (9.9%, a difference of 0.50%).
| Demographics | Rating | Rank | Male Poverty |
| Czechs | 99.4 /100 | #36 | Exceptional 9.8% |
| Immigrants | Greece | 99.3 /100 | #37 | Exceptional 9.8% |
| Immigrants | Pakistan | 99.2 /100 | #38 | Exceptional 9.9% |
| Russians | 99.2 /100 | #39 | Exceptional 9.9% |
| Cypriots | 99.2 /100 | #40 | Exceptional 9.9% |
| Koreans | 99.2 /100 | #41 | Exceptional 9.9% |
| Immigrants | Iran | 99.1 /100 | #42 | Exceptional 9.9% |
| Immigrants | Moldova | 99.0 /100 | #43 | Exceptional 9.9% |
| Immigrants | Romania | 98.9 /100 | #44 | Exceptional 9.9% |
| Immigrants | Serbia | 98.9 /100 | #45 | Exceptional 10.0% |
| Turks | 98.9 /100 | #46 | Exceptional 10.0% |
| Immigrants | Singapore | 98.8 /100 | #47 | Exceptional 10.0% |
| Immigrants | Japan | 98.8 /100 | #48 | Exceptional 10.0% |
| Slovenes | 98.8 /100 | #49 | Exceptional 10.0% |
| Immigrants | Philippines | 98.7 /100 | #50 | Exceptional 10.0% |