Nonimmigrants vs Immigrants from Morocco 7th Grade
COMPARE
Nonimmigrants
Immigrants from Morocco
7th Grade
7th Grade Comparison
Nonimmigrants
Immigrants from Morocco
96.5%
7TH GRADE
97.0/ 100
METRIC RATING
112th/ 347
METRIC RANK
95.8%
7TH GRADE
12.6/ 100
METRIC RATING
213th/ 347
METRIC RANK
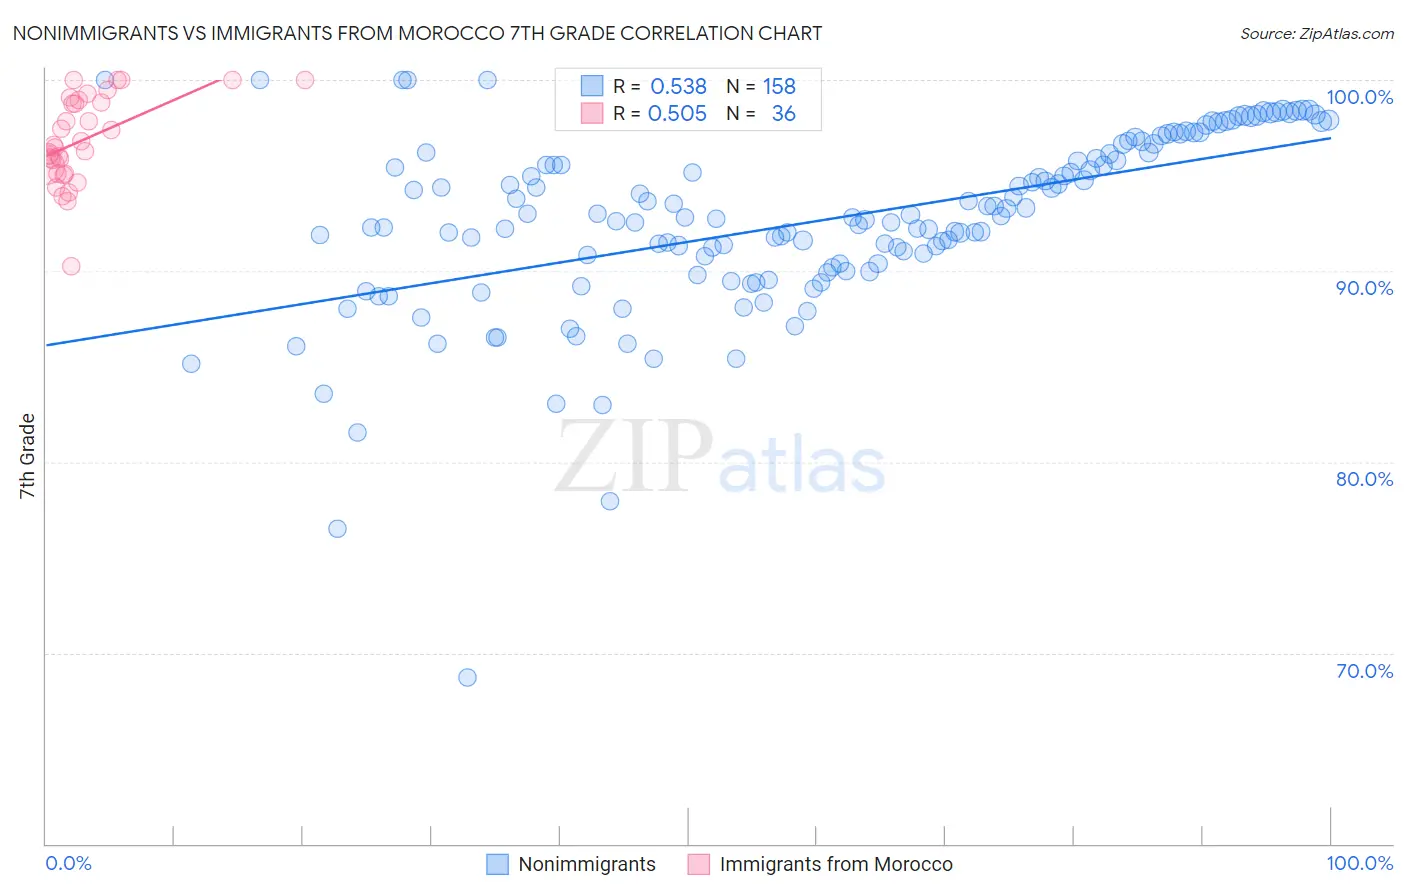
Nonimmigrants vs Immigrants from Morocco 7th Grade Correlation Chart
The statistical analysis conducted on geographies consisting of 585,374,406 people shows a substantial positive correlation between the proportion of Nonimmigrants and percentage of population with at least 7th grade education in the United States with a correlation coefficient (R) of 0.538 and weighted average of 96.5%. Similarly, the statistical analysis conducted on geographies consisting of 178,910,634 people shows a substantial positive correlation between the proportion of Immigrants from Morocco and percentage of population with at least 7th grade education in the United States with a correlation coefficient (R) of 0.505 and weighted average of 95.8%, a difference of 0.83%.
7th Grade Correlation Summary
| Measurement | Nonimmigrants | Immigrants from Morocco |
| Minimum | 68.7% | 90.2% |
| Maximum | 100.0% | 100.0% |
| Range | 31.3% | 9.8% |
| Mean | 92.6% | 96.9% |
| Median | 92.8% | 96.5% |
| Interquartile 25% (IQ1) | 90.2% | 95.3% |
| Interquartile 75% (IQ3) | 96.1% | 98.9% |
| Interquartile Range (IQR) | 5.9% | 3.6% |
| Standard Deviation (Sample) | 4.7% | 2.3% |
| Standard Deviation (Population) | 4.7% | 2.3% |
Similar Demographics by 7th Grade
Demographics Similar to Nonimmigrants by 7th Grade
In terms of 7th grade, the demographic groups most similar to Nonimmigrants are Pueblo (96.5%, a difference of 0.010%), Okinawan (96.6%, a difference of 0.020%), Immigrants from Latvia (96.6%, a difference of 0.020%), Immigrants from Zimbabwe (96.5%, a difference of 0.020%), and Choctaw (96.5%, a difference of 0.020%).
| Demographics | Rating | Rank | 7th Grade |
| South Africans | 98.0 /100 | #105 | Exceptional 96.6% |
| Iroquois | 97.9 /100 | #106 | Exceptional 96.6% |
| Lumbee | 97.8 /100 | #107 | Exceptional 96.6% |
| Immigrants | Saudi Arabia | 97.8 /100 | #108 | Exceptional 96.6% |
| Bhutanese | 97.7 /100 | #109 | Exceptional 96.6% |
| Okinawans | 97.4 /100 | #110 | Exceptional 96.6% |
| Immigrants | Latvia | 97.4 /100 | #111 | Exceptional 96.6% |
| Immigrants | Nonimmigrants | 97.0 /100 | #112 | Exceptional 96.5% |
| Pueblo | 96.8 /100 | #113 | Exceptional 96.5% |
| Immigrants | Zimbabwe | 96.6 /100 | #114 | Exceptional 96.5% |
| Choctaw | 96.6 /100 | #115 | Exceptional 96.5% |
| Syrians | 96.6 /100 | #116 | Exceptional 96.5% |
| Immigrants | Moldova | 95.7 /100 | #117 | Exceptional 96.5% |
| Immigrants | Japan | 95.5 /100 | #118 | Exceptional 96.5% |
| Immigrants | Norway | 95.2 /100 | #119 | Exceptional 96.5% |
Demographics Similar to Immigrants from Morocco by 7th Grade
In terms of 7th grade, the demographic groups most similar to Immigrants from Morocco are Immigrants from Lebanon (95.8%, a difference of 0.0%), Portuguese (95.8%, a difference of 0.010%), Bahamian (95.7%, a difference of 0.010%), Dutch West Indian (95.8%, a difference of 0.040%), and Hawaiian (95.8%, a difference of 0.040%).
| Demographics | Rating | Rank | 7th Grade |
| Africans | 17.6 /100 | #206 | Poor 95.8% |
| Navajo | 17.0 /100 | #207 | Poor 95.8% |
| Immigrants | Sudan | 17.0 /100 | #208 | Poor 95.8% |
| Dutch West Indians | 16.1 /100 | #209 | Poor 95.8% |
| Hawaiians | 16.0 /100 | #210 | Poor 95.8% |
| Portuguese | 13.6 /100 | #211 | Poor 95.8% |
| Immigrants | Lebanon | 13.0 /100 | #212 | Poor 95.8% |
| Immigrants | Morocco | 12.6 /100 | #213 | Poor 95.8% |
| Bahamians | 11.6 /100 | #214 | Poor 95.7% |
| Spanish Americans | 9.3 /100 | #215 | Tragic 95.7% |
| Immigrants | Chile | 9.1 /100 | #216 | Tragic 95.7% |
| Immigrants | Pakistan | 9.0 /100 | #217 | Tragic 95.7% |
| Immigrants | Liberia | 8.1 /100 | #218 | Tragic 95.7% |
| Immigrants | Southern Europe | 7.9 /100 | #219 | Tragic 95.7% |
| Sub-Saharan Africans | 7.2 /100 | #220 | Tragic 95.7% |