Nigerian vs Pennsylvania German Family Poverty
COMPARE
Nigerian
Pennsylvania German
Family Poverty
Family Poverty Comparison
Nigerians
Pennsylvania Germans
10.1%
FAMILY POVERTY
2.0/ 100
METRIC RATING
235th/ 347
METRIC RANK
8.8%
FAMILY POVERTY
66.0/ 100
METRIC RATING
163rd/ 347
METRIC RANK
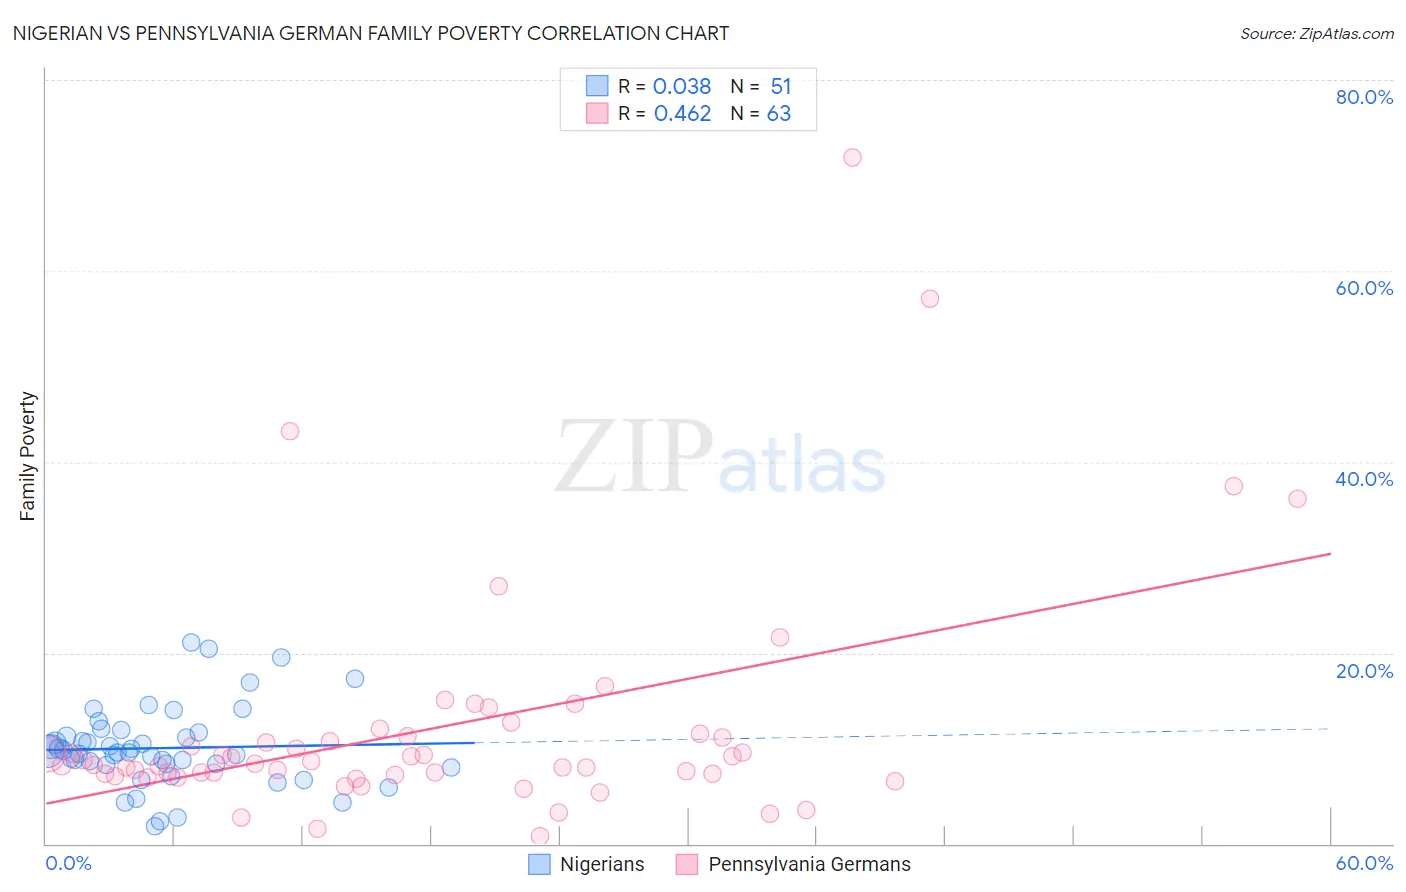
Nigerian vs Pennsylvania German Family Poverty Correlation Chart
The statistical analysis conducted on geographies consisting of 332,122,343 people shows no correlation between the proportion of Nigerians and poverty level among families in the United States with a correlation coefficient (R) of 0.038 and weighted average of 10.1%. Similarly, the statistical analysis conducted on geographies consisting of 233,657,746 people shows a moderate positive correlation between the proportion of Pennsylvania Germans and poverty level among families in the United States with a correlation coefficient (R) of 0.462 and weighted average of 8.8%, a difference of 15.2%.
Family Poverty Correlation Summary
| Measurement | Nigerian | Pennsylvania German |
| Minimum | 1.9% | 0.74% |
| Maximum | 21.1% | 71.9% |
| Range | 19.2% | 71.1% |
| Mean | 10.0% | 12.1% |
| Median | 9.6% | 8.4% |
| Interquartile 25% (IQ1) | 8.3% | 7.2% |
| Interquartile 75% (IQ3) | 11.6% | 11.3% |
| Interquartile Range (IQR) | 3.4% | 4.1% |
| Standard Deviation (Sample) | 4.2% | 12.3% |
| Standard Deviation (Population) | 4.1% | 12.2% |
Similar Demographics by Family Poverty
Demographics Similar to Nigerians by Family Poverty
In terms of family poverty, the demographic groups most similar to Nigerians are Immigrants from Middle Africa (10.1%, a difference of 0.030%), Fijian (10.1%, a difference of 0.14%), Immigrants from Nigeria (10.2%, a difference of 0.25%), Immigrants from Sudan (10.1%, a difference of 0.39%), and Immigrants from Laos (10.2%, a difference of 0.51%).
| Demographics | Rating | Rank | Family Poverty |
| Sudanese | 3.1 /100 | #228 | Tragic 10.0% |
| Immigrants | Uzbekistan | 3.1 /100 | #229 | Tragic 10.0% |
| Immigrants | Panama | 3.1 /100 | #230 | Tragic 10.0% |
| Alaskan Athabascans | 2.7 /100 | #231 | Tragic 10.1% |
| Immigrants | Sudan | 2.3 /100 | #232 | Tragic 10.1% |
| Fijians | 2.1 /100 | #233 | Tragic 10.1% |
| Immigrants | Middle Africa | 2.1 /100 | #234 | Tragic 10.1% |
| Nigerians | 2.0 /100 | #235 | Tragic 10.1% |
| Immigrants | Nigeria | 1.9 /100 | #236 | Tragic 10.2% |
| Immigrants | Laos | 1.7 /100 | #237 | Tragic 10.2% |
| French American Indians | 1.5 /100 | #238 | Tragic 10.2% |
| Potawatomi | 1.5 /100 | #239 | Tragic 10.2% |
| Immigrants | Azores | 1.4 /100 | #240 | Tragic 10.3% |
| Ghanaians | 1.3 /100 | #241 | Tragic 10.3% |
| Alaska Natives | 1.0 /100 | #242 | Tragic 10.4% |
Demographics Similar to Pennsylvania Germans by Family Poverty
In terms of family poverty, the demographic groups most similar to Pennsylvania Germans are Ethiopian (8.8%, a difference of 0.050%), Immigrants from Northern Africa (8.8%, a difference of 0.14%), Celtic (8.8%, a difference of 0.16%), Hungarian (8.8%, a difference of 0.18%), and Guamanian/Chamorro (8.8%, a difference of 0.19%).
| Demographics | Rating | Rank | Family Poverty |
| Immigrants | Oceania | 71.2 /100 | #156 | Good 8.7% |
| Tsimshian | 69.3 /100 | #157 | Good 8.8% |
| Whites/Caucasians | 69.1 /100 | #158 | Good 8.8% |
| Peruvians | 68.0 /100 | #159 | Good 8.8% |
| Hungarians | 67.2 /100 | #160 | Good 8.8% |
| Immigrants | Northern Africa | 66.9 /100 | #161 | Good 8.8% |
| Ethiopians | 66.3 /100 | #162 | Good 8.8% |
| Pennsylvania Germans | 66.0 /100 | #163 | Good 8.8% |
| Celtics | 64.9 /100 | #164 | Good 8.8% |
| Guamanians/Chamorros | 64.7 /100 | #165 | Good 8.8% |
| Afghans | 63.5 /100 | #166 | Good 8.8% |
| Immigrants | Ethiopia | 62.5 /100 | #167 | Good 8.9% |
| Israelis | 62.1 /100 | #168 | Good 8.9% |
| Immigrants | Chile | 59.6 /100 | #169 | Average 8.9% |
| Kenyans | 58.2 /100 | #170 | Average 8.9% |