Immigrants from Ireland vs Portuguese Family Poverty
COMPARE
Immigrants from Ireland
Portuguese
Family Poverty
Family Poverty Comparison
Immigrants from Ireland
Portuguese
7.0%
FAMILY POVERTY
99.9/ 100
METRIC RATING
7th/ 347
METRIC RANK
8.4%
FAMILY POVERTY
89.2/ 100
METRIC RATING
129th/ 347
METRIC RANK
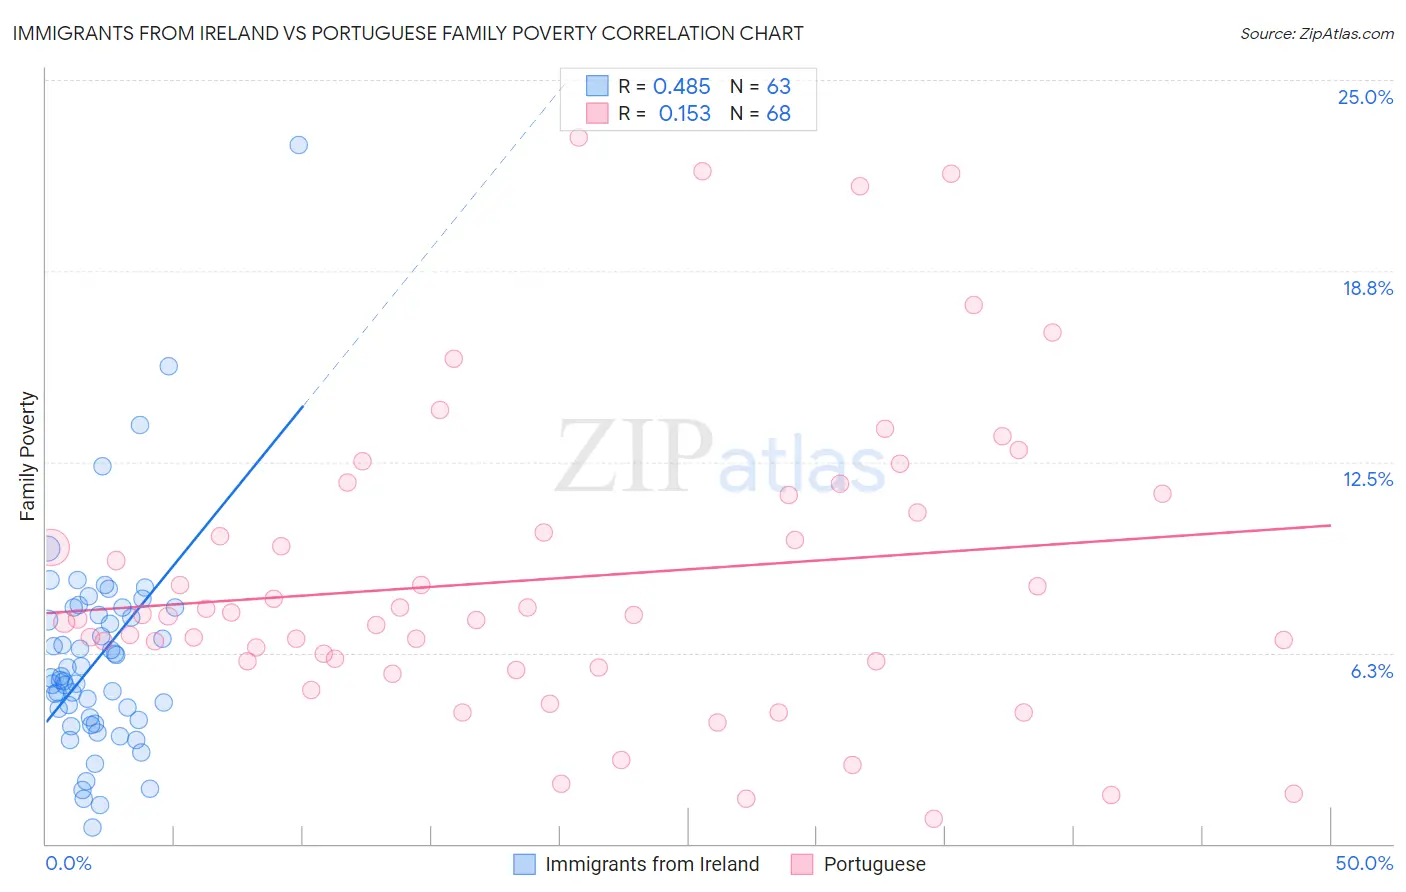
Immigrants from Ireland vs Portuguese Family Poverty Correlation Chart
The statistical analysis conducted on geographies consisting of 240,395,025 people shows a moderate positive correlation between the proportion of Immigrants from Ireland and poverty level among families in the United States with a correlation coefficient (R) of 0.485 and weighted average of 7.0%. Similarly, the statistical analysis conducted on geographies consisting of 448,364,700 people shows a poor positive correlation between the proportion of Portuguese and poverty level among families in the United States with a correlation coefficient (R) of 0.153 and weighted average of 8.4%, a difference of 20.1%.
Family Poverty Correlation Summary
| Measurement | Immigrants from Ireland | Portuguese |
| Minimum | 0.55% | 0.81% |
| Maximum | 22.9% | 23.1% |
| Range | 22.3% | 22.3% |
| Mean | 6.1% | 8.7% |
| Median | 5.4% | 7.5% |
| Interquartile 25% (IQ1) | 4.0% | 6.0% |
| Interquartile 75% (IQ3) | 7.7% | 11.1% |
| Interquartile Range (IQR) | 3.7% | 5.1% |
| Standard Deviation (Sample) | 3.5% | 5.0% |
| Standard Deviation (Population) | 3.5% | 4.9% |
Similar Demographics by Family Poverty
Demographics Similar to Immigrants from Ireland by Family Poverty
In terms of family poverty, the demographic groups most similar to Immigrants from Ireland are Bhutanese (7.0%, a difference of 0.91%), Latvian (7.1%, a difference of 1.3%), Norwegian (6.9%, a difference of 1.4%), Bulgarian (7.1%, a difference of 1.6%), and Immigrants from Singapore (7.1%, a difference of 1.6%).
| Demographics | Rating | Rank | Family Poverty |
| Immigrants | India | 100.0 /100 | #1 | Exceptional 6.2% |
| Chinese | 100.0 /100 | #2 | Exceptional 6.5% |
| Immigrants | Taiwan | 100.0 /100 | #3 | Exceptional 6.6% |
| Filipinos | 100.0 /100 | #4 | Exceptional 6.6% |
| Thais | 100.0 /100 | #5 | Exceptional 6.7% |
| Norwegians | 99.9 /100 | #6 | Exceptional 6.9% |
| Immigrants | Ireland | 99.9 /100 | #7 | Exceptional 7.0% |
| Bhutanese | 99.9 /100 | #8 | Exceptional 7.0% |
| Latvians | 99.9 /100 | #9 | Exceptional 7.1% |
| Bulgarians | 99.8 /100 | #10 | Exceptional 7.1% |
| Immigrants | Singapore | 99.8 /100 | #11 | Exceptional 7.1% |
| Maltese | 99.8 /100 | #12 | Exceptional 7.1% |
| Swedes | 99.8 /100 | #13 | Exceptional 7.1% |
| Iranians | 99.8 /100 | #14 | Exceptional 7.1% |
| Lithuanians | 99.8 /100 | #15 | Exceptional 7.2% |
Demographics Similar to Portuguese by Family Poverty
In terms of family poverty, the demographic groups most similar to Portuguese are Argentinean (8.4%, a difference of 0.15%), Immigrants from Bosnia and Herzegovina (8.4%, a difference of 0.18%), Puget Sound Salish (8.4%, a difference of 0.19%), Immigrants from Hungary (8.4%, a difference of 0.30%), and Immigrants from Argentina (8.4%, a difference of 0.34%).
| Demographics | Rating | Rank | Family Poverty |
| Paraguayans | 91.2 /100 | #122 | Exceptional 8.3% |
| Palestinians | 91.1 /100 | #123 | Exceptional 8.3% |
| Soviet Union | 90.8 /100 | #124 | Exceptional 8.3% |
| Pakistanis | 90.8 /100 | #125 | Exceptional 8.3% |
| Icelanders | 90.3 /100 | #126 | Exceptional 8.3% |
| Immigrants | Hungary | 89.9 /100 | #127 | Excellent 8.4% |
| Argentineans | 89.6 /100 | #128 | Excellent 8.4% |
| Portuguese | 89.2 /100 | #129 | Excellent 8.4% |
| Immigrants | Bosnia and Herzegovina | 88.6 /100 | #130 | Excellent 8.4% |
| Puget Sound Salish | 88.6 /100 | #131 | Excellent 8.4% |
| Immigrants | Argentina | 88.2 /100 | #132 | Excellent 8.4% |
| Sri Lankans | 86.6 /100 | #133 | Excellent 8.5% |
| Chileans | 86.6 /100 | #134 | Excellent 8.5% |
| Immigrants | Malaysia | 86.5 /100 | #135 | Excellent 8.5% |
| Immigrants | Brazil | 86.3 /100 | #136 | Excellent 8.5% |