Nicaraguan vs Bangladeshi Female Poverty
COMPARE
Nicaraguan
Bangladeshi
Female Poverty
Female Poverty Comparison
Nicaraguans
Bangladeshis
15.3%
FEMALE POVERTY
0.3/ 100
METRIC RATING
243rd/ 347
METRIC RANK
16.0%
FEMALE POVERTY
0.0/ 100
METRIC RATING
277th/ 347
METRIC RANK
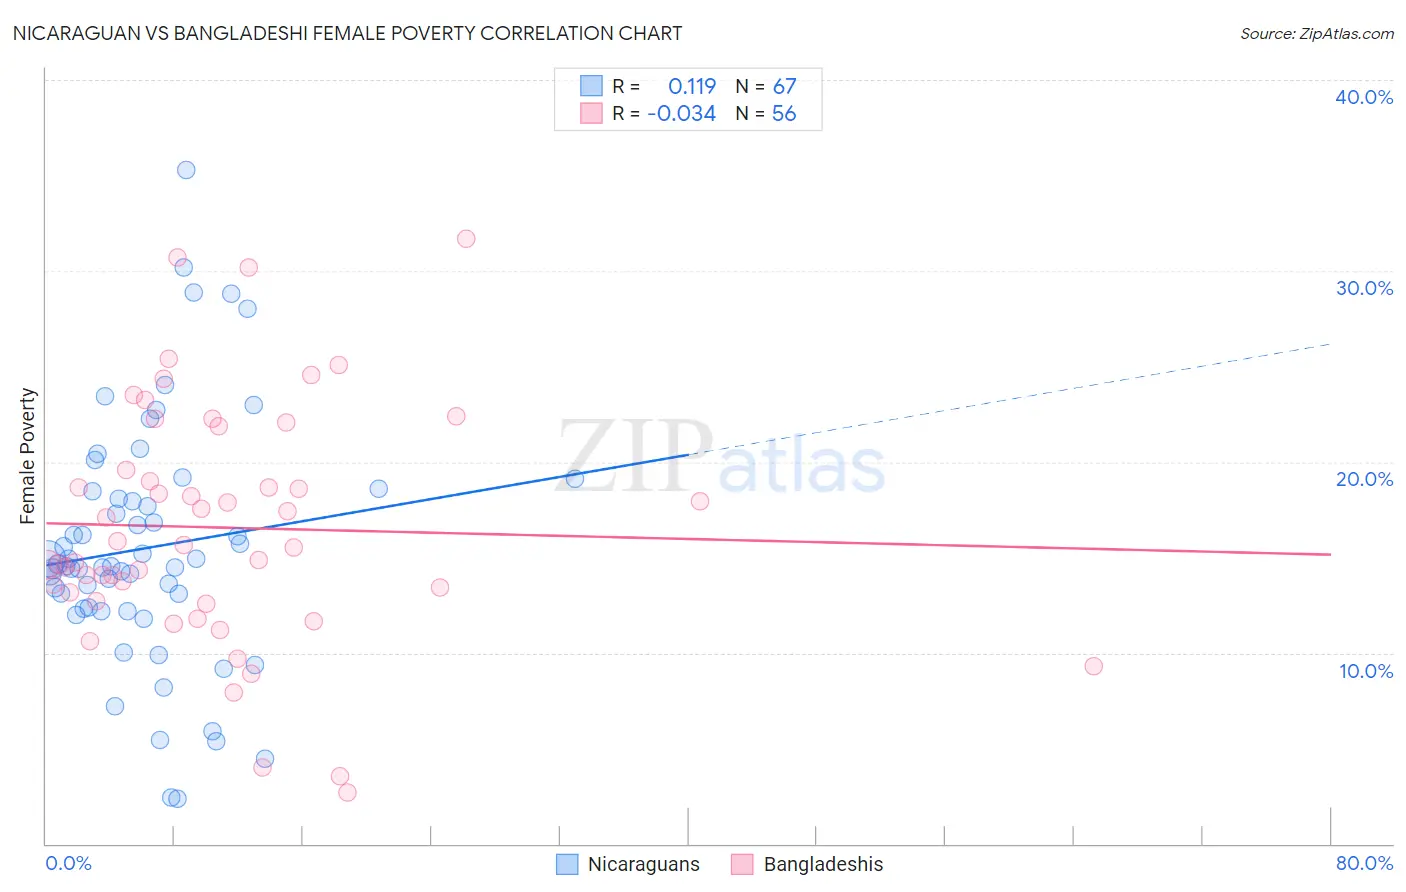
Nicaraguan vs Bangladeshi Female Poverty Correlation Chart
The statistical analysis conducted on geographies consisting of 285,582,633 people shows a poor positive correlation between the proportion of Nicaraguans and poverty level among females in the United States with a correlation coefficient (R) of 0.119 and weighted average of 15.3%. Similarly, the statistical analysis conducted on geographies consisting of 141,353,886 people shows no correlation between the proportion of Bangladeshis and poverty level among females in the United States with a correlation coefficient (R) of -0.034 and weighted average of 16.0%, a difference of 4.8%.
Female Poverty Correlation Summary
| Measurement | Nicaraguan | Bangladeshi |
| Minimum | 2.4% | 2.7% |
| Maximum | 35.3% | 31.7% |
| Range | 32.9% | 29.0% |
| Mean | 15.5% | 16.6% |
| Median | 14.6% | 15.6% |
| Interquartile 25% (IQ1) | 12.3% | 12.9% |
| Interquartile 75% (IQ3) | 18.5% | 20.7% |
| Interquartile Range (IQR) | 6.2% | 7.8% |
| Standard Deviation (Sample) | 6.4% | 6.3% |
| Standard Deviation (Population) | 6.3% | 6.2% |
Similar Demographics by Female Poverty
Demographics Similar to Nicaraguans by Female Poverty
In terms of female poverty, the demographic groups most similar to Nicaraguans are Ecuadorian (15.3%, a difference of 0.050%), Spanish American Indian (15.3%, a difference of 0.15%), Cuban (15.3%, a difference of 0.20%), Potawatomi (15.3%, a difference of 0.21%), and Immigrants from Ghana (15.3%, a difference of 0.21%).
| Demographics | Rating | Rank | Female Poverty |
| Cree | 0.7 /100 | #236 | Tragic 15.1% |
| French American Indians | 0.6 /100 | #237 | Tragic 15.1% |
| Immigrants | Armenia | 0.6 /100 | #238 | Tragic 15.1% |
| Immigrants | Middle Africa | 0.5 /100 | #239 | Tragic 15.2% |
| Sudanese | 0.5 /100 | #240 | Tragic 15.2% |
| Immigrants | Sudan | 0.4 /100 | #241 | Tragic 15.2% |
| Nepalese | 0.4 /100 | #242 | Tragic 15.2% |
| Nicaraguans | 0.3 /100 | #243 | Tragic 15.3% |
| Ecuadorians | 0.3 /100 | #244 | Tragic 15.3% |
| Spanish American Indians | 0.3 /100 | #245 | Tragic 15.3% |
| Cubans | 0.3 /100 | #246 | Tragic 15.3% |
| Potawatomi | 0.3 /100 | #247 | Tragic 15.3% |
| Immigrants | Ghana | 0.3 /100 | #248 | Tragic 15.3% |
| Salvadorans | 0.3 /100 | #249 | Tragic 15.3% |
| Immigrants | Western Africa | 0.3 /100 | #250 | Tragic 15.3% |
Demographics Similar to Bangladeshis by Female Poverty
In terms of female poverty, the demographic groups most similar to Bangladeshis are Central American (16.0%, a difference of 0.19%), Immigrants from Barbados (16.0%, a difference of 0.31%), Immigrants from West Indies (16.1%, a difference of 0.31%), Haitian (15.9%, a difference of 0.38%), and Barbadian (15.9%, a difference of 0.38%).
| Demographics | Rating | Rank | Female Poverty |
| Chickasaw | 0.1 /100 | #270 | Tragic 15.9% |
| Immigrants | St. Vincent and the Grenadines | 0.0 /100 | #271 | Tragic 15.9% |
| Belizeans | 0.0 /100 | #272 | Tragic 15.9% |
| Haitians | 0.0 /100 | #273 | Tragic 15.9% |
| Barbadians | 0.0 /100 | #274 | Tragic 15.9% |
| Immigrants | Barbados | 0.0 /100 | #275 | Tragic 16.0% |
| Central Americans | 0.0 /100 | #276 | Tragic 16.0% |
| Bangladeshis | 0.0 /100 | #277 | Tragic 16.0% |
| Immigrants | West Indies | 0.0 /100 | #278 | Tragic 16.1% |
| Immigrants | Bahamas | 0.0 /100 | #279 | Tragic 16.1% |
| Vietnamese | 0.0 /100 | #280 | Tragic 16.1% |
| West Indians | 0.0 /100 | #281 | Tragic 16.1% |
| Immigrants | Haiti | 0.0 /100 | #282 | Tragic 16.1% |
| Immigrants | Cuba | 0.0 /100 | #283 | Tragic 16.1% |
| Spanish Americans | 0.0 /100 | #284 | Tragic 16.2% |