Nicaraguan vs Immigrants from Lithuania Female Disability
COMPARE
Nicaraguan
Immigrants from Lithuania
Female Disability
Female Disability Comparison
Nicaraguans
Immigrants from Lithuania
11.9%
FEMALE DISABILITY
95.2/ 100
METRIC RATING
130th/ 347
METRIC RANK
11.2%
FEMALE DISABILITY
100.0/ 100
METRIC RATING
39th/ 347
METRIC RANK
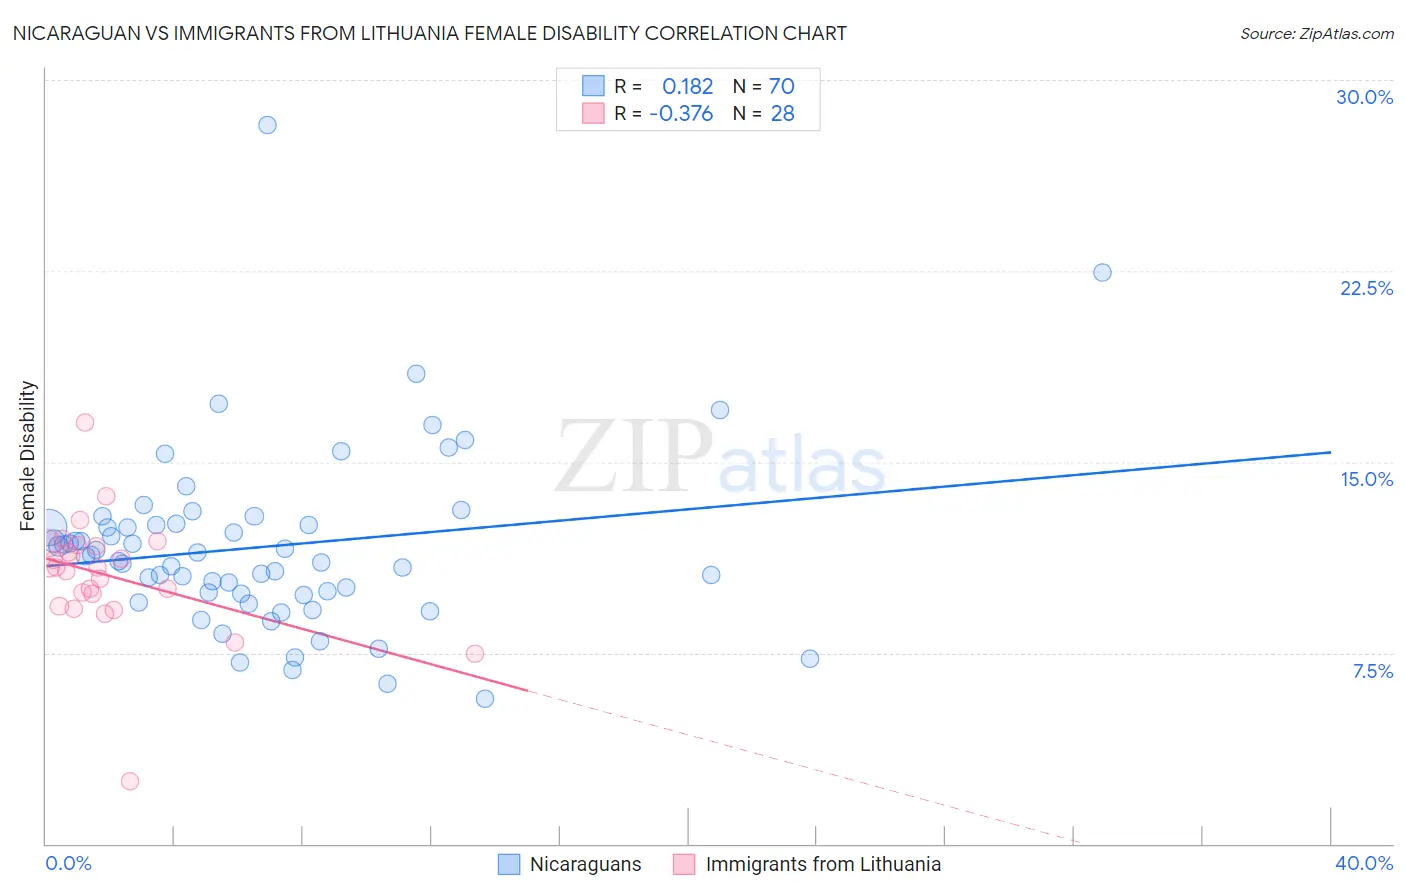
Nicaraguan vs Immigrants from Lithuania Female Disability Correlation Chart
The statistical analysis conducted on geographies consisting of 285,687,392 people shows a poor positive correlation between the proportion of Nicaraguans and percentage of females with a disability in the United States with a correlation coefficient (R) of 0.182 and weighted average of 11.9%. Similarly, the statistical analysis conducted on geographies consisting of 117,714,022 people shows a mild negative correlation between the proportion of Immigrants from Lithuania and percentage of females with a disability in the United States with a correlation coefficient (R) of -0.376 and weighted average of 11.2%, a difference of 5.6%.
Female Disability Correlation Summary
| Measurement | Nicaraguan | Immigrants from Lithuania |
| Minimum | 5.7% | 2.4% |
| Maximum | 28.3% | 16.5% |
| Range | 22.6% | 14.1% |
| Mean | 11.7% | 10.5% |
| Median | 11.3% | 10.8% |
| Interquartile 25% (IQ1) | 9.8% | 9.6% |
| Interquartile 75% (IQ3) | 12.5% | 11.7% |
| Interquartile Range (IQR) | 2.7% | 2.1% |
| Standard Deviation (Sample) | 3.5% | 2.4% |
| Standard Deviation (Population) | 3.5% | 2.3% |
Similar Demographics by Female Disability
Demographics Similar to Nicaraguans by Female Disability
In terms of female disability, the demographic groups most similar to Nicaraguans are Arab (11.9%, a difference of 0.030%), Macedonian (11.8%, a difference of 0.060%), Immigrants from Latvia (11.8%, a difference of 0.090%), Immigrants from Syria (11.9%, a difference of 0.12%), and South American Indian (11.8%, a difference of 0.13%).
| Demographics | Rating | Rank | Female Disability |
| Immigrants | Croatia | 96.7 /100 | #123 | Exceptional 11.8% |
| Russians | 96.5 /100 | #124 | Exceptional 11.8% |
| Immigrants | Italy | 96.4 /100 | #125 | Exceptional 11.8% |
| Immigrants | Europe | 96.2 /100 | #126 | Exceptional 11.8% |
| South American Indians | 95.8 /100 | #127 | Exceptional 11.8% |
| Immigrants | Latvia | 95.6 /100 | #128 | Exceptional 11.8% |
| Macedonians | 95.5 /100 | #129 | Exceptional 11.8% |
| Nicaraguans | 95.2 /100 | #130 | Exceptional 11.9% |
| Arabs | 95.1 /100 | #131 | Exceptional 11.9% |
| Immigrants | Syria | 94.6 /100 | #132 | Exceptional 11.9% |
| Kenyans | 94.5 /100 | #133 | Exceptional 11.9% |
| Immigrants | Nicaragua | 94.5 /100 | #134 | Exceptional 11.9% |
| Central Americans | 94.2 /100 | #135 | Exceptional 11.9% |
| Ugandans | 94.0 /100 | #136 | Exceptional 11.9% |
| Immigrants | Norway | 93.8 /100 | #137 | Exceptional 11.9% |
Demographics Similar to Immigrants from Lithuania by Female Disability
In terms of female disability, the demographic groups most similar to Immigrants from Lithuania are Mongolian (11.2%, a difference of 0.030%), Paraguayan (11.2%, a difference of 0.050%), Israeli (11.2%, a difference of 0.15%), Afghan (11.2%, a difference of 0.17%), and Immigrants from Ethiopia (11.2%, a difference of 0.21%).
| Demographics | Rating | Rank | Female Disability |
| Immigrants | Australia | 100.0 /100 | #32 | Exceptional 11.1% |
| Immigrants | Egypt | 100.0 /100 | #33 | Exceptional 11.1% |
| Immigrants | Indonesia | 100.0 /100 | #34 | Exceptional 11.2% |
| Immigrants | Japan | 100.0 /100 | #35 | Exceptional 11.2% |
| Cypriots | 100.0 /100 | #36 | Exceptional 11.2% |
| Ethiopians | 100.0 /100 | #37 | Exceptional 11.2% |
| Immigrants | Ethiopia | 100.0 /100 | #38 | Exceptional 11.2% |
| Immigrants | Lithuania | 100.0 /100 | #39 | Exceptional 11.2% |
| Mongolians | 100.0 /100 | #40 | Exceptional 11.2% |
| Paraguayans | 100.0 /100 | #41 | Exceptional 11.2% |
| Israelis | 100.0 /100 | #42 | Exceptional 11.2% |
| Afghans | 100.0 /100 | #43 | Exceptional 11.2% |
| Cambodians | 100.0 /100 | #44 | Exceptional 11.3% |
| Immigrants | Sweden | 100.0 /100 | #45 | Exceptional 11.3% |
| Immigrants | Nepal | 100.0 /100 | #46 | Exceptional 11.3% |