Nicaraguan vs Immigrants from Lithuania Unemployment Among Ages 65 to 74 years
COMPARE
Nicaraguan
Immigrants from Lithuania
Unemployment Among Ages 65 to 74 years
Unemployment Among Ages 65 to 74 years Comparison
Nicaraguans
Immigrants from Lithuania
5.1%
UNEMPLOYMENT AMONG AGES 65 TO 74 YEARS
99.4/ 100
METRIC RATING
62nd/ 347
METRIC RANK
5.2%
UNEMPLOYMENT AMONG AGES 65 TO 74 YEARS
95.9/ 100
METRIC RATING
102nd/ 347
METRIC RANK
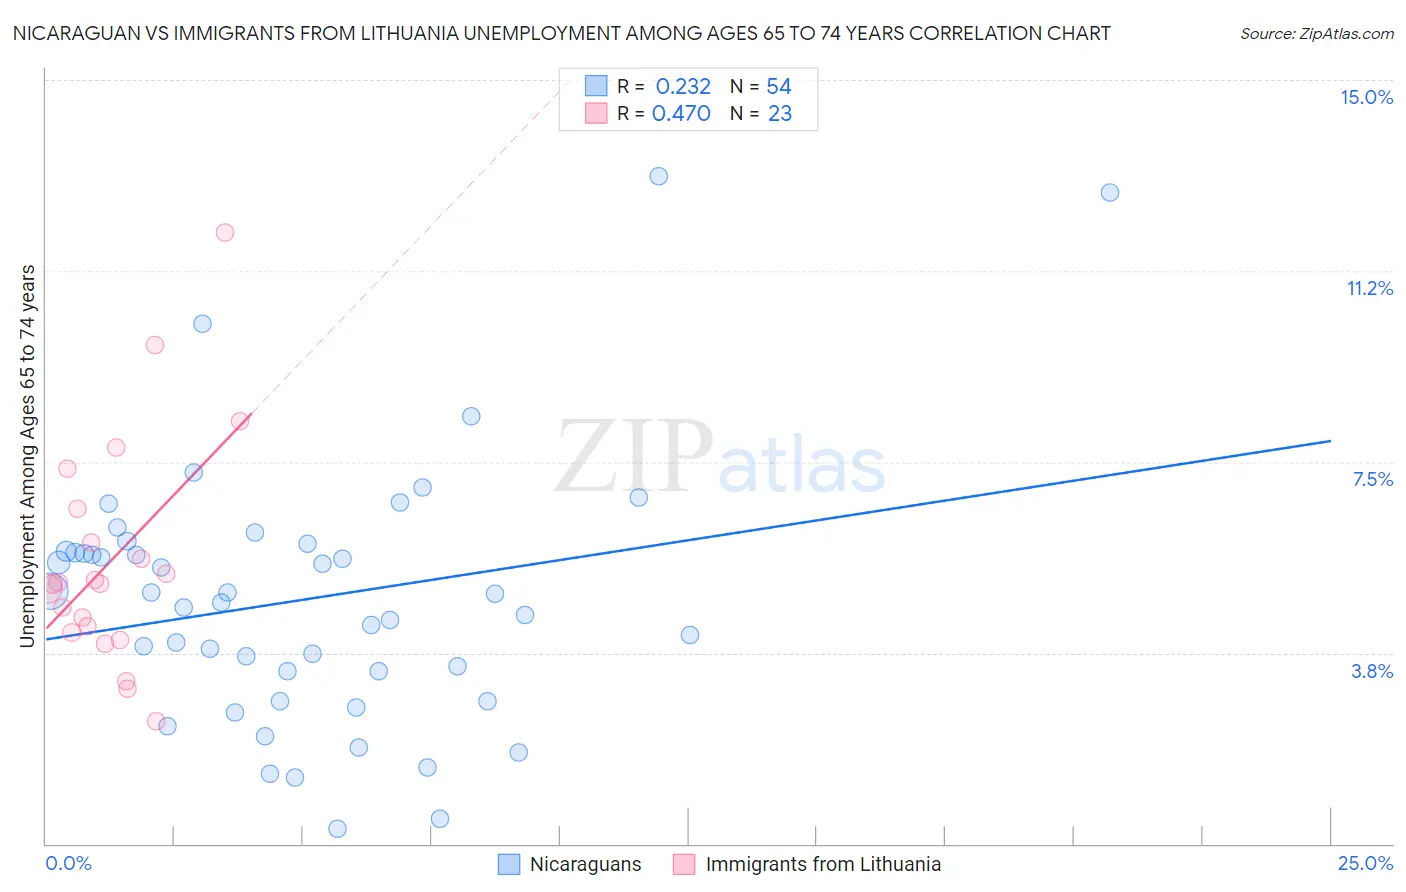
Nicaraguan vs Immigrants from Lithuania Unemployment Among Ages 65 to 74 years Correlation Chart
The statistical analysis conducted on geographies consisting of 263,256,911 people shows a weak positive correlation between the proportion of Nicaraguans and unemployment rate among population between the ages 65 and 74 in the United States with a correlation coefficient (R) of 0.232 and weighted average of 5.1%. Similarly, the statistical analysis conducted on geographies consisting of 112,270,801 people shows a moderate positive correlation between the proportion of Immigrants from Lithuania and unemployment rate among population between the ages 65 and 74 in the United States with a correlation coefficient (R) of 0.470 and weighted average of 5.2%, a difference of 1.6%.
Unemployment Among Ages 65 to 74 years Correlation Summary
| Measurement | Nicaraguan | Immigrants from Lithuania |
| Minimum | 0.30% | 2.4% |
| Maximum | 13.1% | 12.0% |
| Range | 12.8% | 9.6% |
| Mean | 4.8% | 5.6% |
| Median | 4.8% | 5.1% |
| Interquartile 25% (IQ1) | 3.4% | 4.2% |
| Interquartile 75% (IQ3) | 5.7% | 6.6% |
| Interquartile Range (IQR) | 2.3% | 2.4% |
| Standard Deviation (Sample) | 2.5% | 2.2% |
| Standard Deviation (Population) | 2.5% | 2.2% |
Similar Demographics by Unemployment Among Ages 65 to 74 years
Demographics Similar to Nicaraguans by Unemployment Among Ages 65 to 74 years
In terms of unemployment among ages 65 to 74 years, the demographic groups most similar to Nicaraguans are Immigrants from Taiwan (5.1%, a difference of 0.010%), Kiowa (5.1%, a difference of 0.040%), Immigrants from Jordan (5.1%, a difference of 0.080%), Immigrants from Moldova (5.1%, a difference of 0.090%), and Bolivian (5.1%, a difference of 0.10%).
| Demographics | Rating | Rank | Unemployment Among Ages 65 to 74 years |
| Carpatho Rusyns | 99.6 /100 | #55 | Exceptional 5.1% |
| Swedes | 99.5 /100 | #56 | Exceptional 5.1% |
| Croatians | 99.5 /100 | #57 | Exceptional 5.1% |
| Germans | 99.5 /100 | #58 | Exceptional 5.1% |
| Immigrants | Bulgaria | 99.4 /100 | #59 | Exceptional 5.1% |
| Immigrants | Jordan | 99.4 /100 | #60 | Exceptional 5.1% |
| Immigrants | Taiwan | 99.4 /100 | #61 | Exceptional 5.1% |
| Nicaraguans | 99.4 /100 | #62 | Exceptional 5.1% |
| Kiowa | 99.3 /100 | #63 | Exceptional 5.1% |
| Immigrants | Moldova | 99.3 /100 | #64 | Exceptional 5.1% |
| Bolivians | 99.3 /100 | #65 | Exceptional 5.1% |
| Iroquois | 99.3 /100 | #66 | Exceptional 5.1% |
| Swiss | 99.2 /100 | #67 | Exceptional 5.1% |
| Latvians | 99.2 /100 | #68 | Exceptional 5.1% |
| Scandinavians | 99.1 /100 | #69 | Exceptional 5.2% |
Demographics Similar to Immigrants from Lithuania by Unemployment Among Ages 65 to 74 years
In terms of unemployment among ages 65 to 74 years, the demographic groups most similar to Immigrants from Lithuania are Immigrants from Vietnam (5.2%, a difference of 0.070%), Yugoslavian (5.2%, a difference of 0.090%), Japanese (5.2%, a difference of 0.10%), Immigrants from Cambodia (5.2%, a difference of 0.10%), and Burmese (5.2%, a difference of 0.12%).
| Demographics | Rating | Rank | Unemployment Among Ages 65 to 74 years |
| Serbians | 97.0 /100 | #95 | Exceptional 5.2% |
| Immigrants | Thailand | 97.0 /100 | #96 | Exceptional 5.2% |
| Senegalese | 96.5 /100 | #97 | Exceptional 5.2% |
| Welsh | 96.5 /100 | #98 | Exceptional 5.2% |
| Burmese | 96.4 /100 | #99 | Exceptional 5.2% |
| Japanese | 96.4 /100 | #100 | Exceptional 5.2% |
| Immigrants | Cambodia | 96.3 /100 | #101 | Exceptional 5.2% |
| Immigrants | Lithuania | 95.9 /100 | #102 | Exceptional 5.2% |
| Immigrants | Vietnam | 95.6 /100 | #103 | Exceptional 5.2% |
| Yugoslavians | 95.5 /100 | #104 | Exceptional 5.2% |
| Iranians | 95.2 /100 | #105 | Exceptional 5.2% |
| Malaysians | 95.1 /100 | #106 | Exceptional 5.2% |
| Austrians | 94.5 /100 | #107 | Exceptional 5.2% |
| Immigrants | Malaysia | 94.1 /100 | #108 | Exceptional 5.2% |
| Immigrants | Singapore | 93.9 /100 | #109 | Exceptional 5.2% |